Highlights
- Check out this blog post featuring interviews with Niklas, kpatenio and jmaher about mentoring for Outreachy
- PDF annotating support is being worked on, and can be tested in Nightly right now! It’s enabled in Nightly and Early Beta for testing.
-
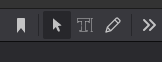
Two new buttons have been added to the toolbar. One allows you to annotate a PDF with text, and the other lets you draw directly on top of it!
- See a bug with it? File it here!
-
- daleharvey made more progress to QuickActions in the URL bar
- To enable the feature in Nightly, create and set browser.urlbar.quickactions.enabled and browser.urlbar.shortcuts.quickactions to true in about:config
- dale added the ability to View Add-ons (addons), View Bookmarks (bookmarks), View Logins (logins, passwords), Open a Private Browsing Window (private), from the URL bar. Try it out by typing out words in the parenthesis in the url bar with QuickActions turned on.
- Various fixes related to the feature, namely removed a flash that happens when typing in the url bar and alignment of address bar results.
- He also added group title for the results and added the ability to localize the commands to other languages
- We are looking to enable this feature in Nightly shortly. If you notice any issues, you can file them here!
- janvi01 added a site-specific wrapper for video.js players!
- This gives us subtitle/caption support for a number of sites that use that library, including:
- PBS
- ABC News
- Funimation
- Mxplayer
- Nebula
- SonyLiv
- Please file a bug here if you encounter any issues or notice any other sites using video.js
- This gives us subtitle/caption support for a number of sites that use that library, including:
- The DevTools team has added the Evaluation Context Selector to the Browser Console
-
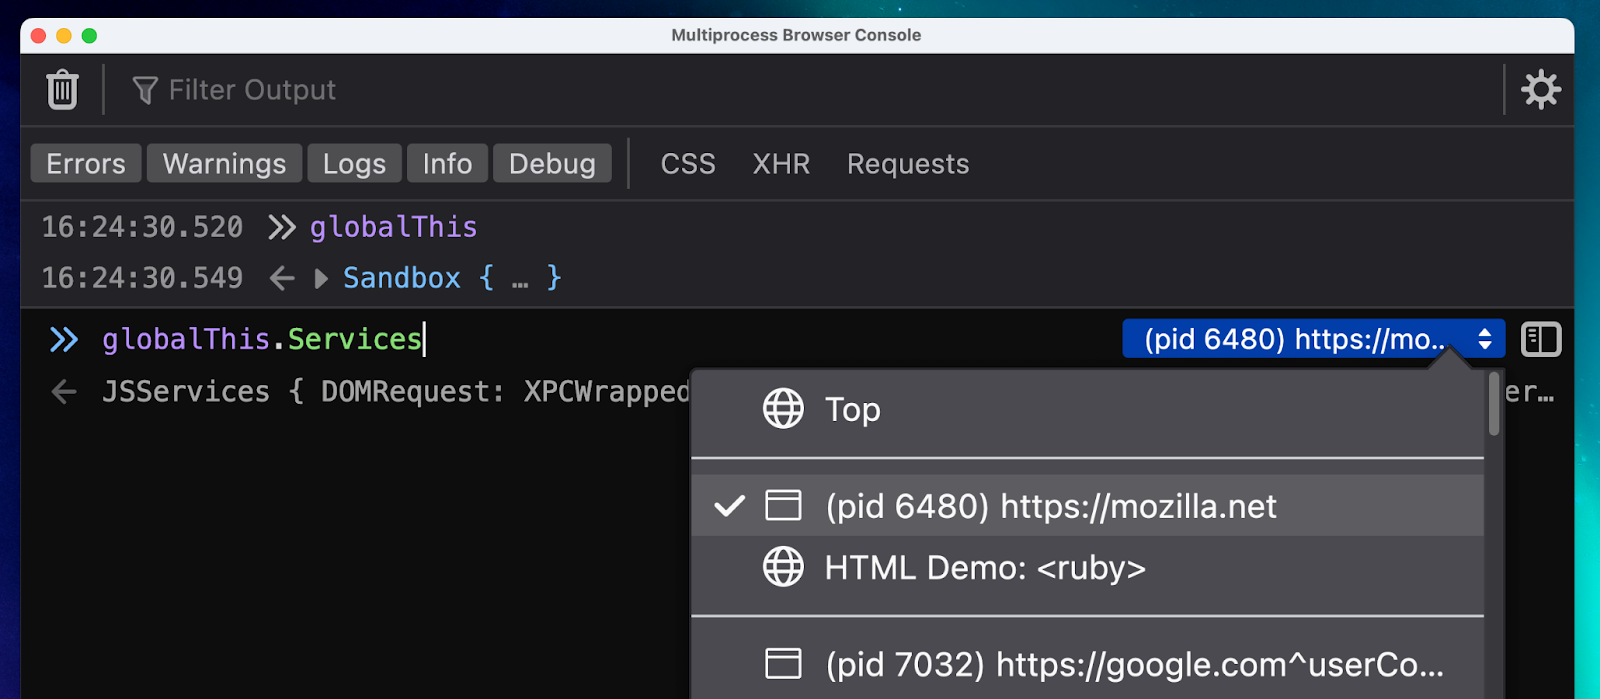
This is handy for users of the Browser Console that want to be able to switch between execution contexts.
-
Friends of the Firefox team
Resolved bugs (excluding employees)
Volunteers that fixed more than one bug
- Janvi Bajoria [:janvi01]
- sayuree
- Shane Hughes [:aminomancer]
New contributors (🌟 = first patch)
- 🌟 camastromonaco removed extraneous CaptivePortalWatcher reference
- Daniel Qeli improved alignment of “Learn more about performance” button with cache headers
- Edward Brace added PiP Subtitles Support for Washington Post
Project Updates
Add-ons / Web Extensions
WebExtensions Framework
-
- As part of the ongoing ManifestVersion 3 (MV3) work:
- New unified extensions toolbar button: William Durand has started to work on the new unified extensions UI – Bug 1777481 / Bug 1778722 / Bug 1780782
- As part of the ongoing ManifestVersion 3 (MV3) work:
-
-
-
- The new unified toolbar button is meant to replace the browserAction toolbar buttons but it does not cover all the features that are currently provided by the browserActions toolbar buttons yet. The new toolbar button is currently only enabled when the “extensions.unifiedExtensions.enabled” preference is explicitly set to true in about:config.
- A huge shout out to both Itiel and James Teh for the great support they provided in the reviews for the unified extensions button!
- Event Pages (non persistent background pages): In Firefox >= 104, the event page will not be terminated if there is an active connection to a native app through the native messaging APIs (browser.runtime.connectNative and browser.runtime.sendNativeMessage) – Bug 1770696
- New web_accessible_resources manifest field syntax: In Firefox >= 104, in the “matches” properties of the web_accessible_resources entries in the manifest_version 3 format supports the “<all_urls>” host permission string – Bug 1776841
-
-
WebExtension APIs
- In Firefox >= 104, restricted schemes (eg. “resources” or “chrome” schemes) are allowed in scripting.registerContentScripts API when called from a (MV2) privileged extension – Bug 1756758
- Fixed a bug with browser.extension.getViews and preloaded browserAction popup pages – Bug 1780008
- Starting from Firefox 104, the history WebExtensions API will use internal PlacesUtils.history async API
- Some extensions (e.g. DownThemAll! add-on) were calling the history API during startup and so this fix will also result in a startup performance improvement for Firefox users that have extensions using this API and blocking web requests triggered during the Firefox startup.
- Huge shout out to Emilio for investigating and fixing this issue!
Developer Tools
Toolbox
- Many thanks to arai for helping us with instant evaluation issues (bug & bug).
- Those patches will prevent the following expression to be instantly evaluated as the user is typing
[1, 2, 3].map(alert)Function.prototype.call.bind(Function.prototype.call)(alert);
- Those patches will prevent the following expression to be instantly evaluated as the user is typing
- We fixed a bug for log points in the Browser Toolbox where the logs would only appear if the “Show Content Messages” setting was checked (bug)
- Julian fixed an issue with debugging addons + reloading (easily triggered when using webext to write your extension) (bug)
- Uplifted to ESR
- Bomsy worked on a couple things in the Netmonitor we should improve memory usage and performance
- Ochameau is still making progress on Debugger source tree stability and performance (bug, bug, bug and bug, showing decent performance improvements to the Browser Toolbox: DAMP results)
WebDriver BiDi
- The team improved the script.evaluate command
- Adding support for the awaitPromise argument (https://bugzilla.mozilla.org/show_bug.cgi?id=1770461)
- Handling errors (https://bugzilla.mozilla.org/show_bug.cgi?id=1770477)
- Handling returned primitive values (https://bugzilla.mozilla.org/show_bug.cgi?id=1770476)
- Basic support for script.callFunction (bug) and implementation for
- Support source for log.entryAdded event ( bug )
ESMification status
-
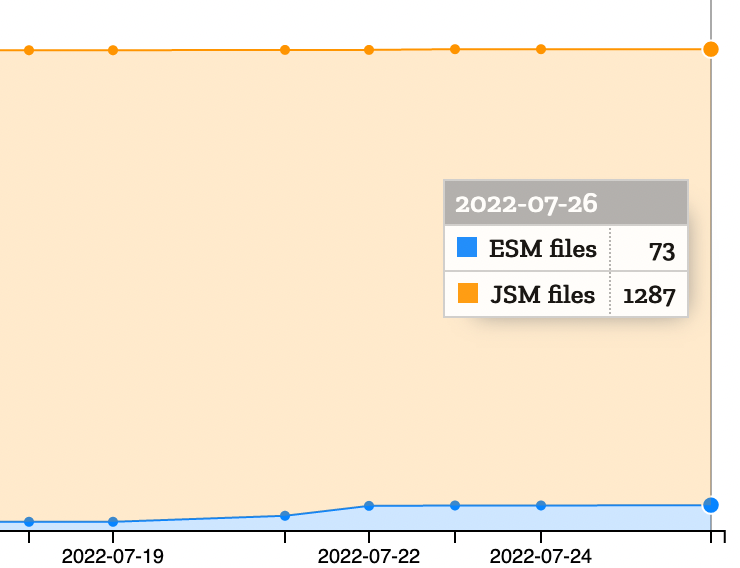
Progress is being made!
- ESMification is underway! We have 73 .sys.mjs files and 1287 jsm files, ~5.6%
- Assuming you don’t have anything complex, Standard8 recommends no more than an hour to do both the .jsm -> .sys.mjs conversion and to convert imports to use .sys.mjs directly using scripts.
- Recommend pushing to the try server to check for issues as well.
- There are example bugs that have already landed shown on areweesmifiedyet.
- If you’re working on a bug, add [esmification-timeline] to the whiteboard so that it gets added and everyone can see.
- Known issues you might hit:
- In attempting to land the address bar conversions, browser_preferences_usage.js fails due to accessing dom.importMaps.enabled too many times. The fix for this is landing today.
- The new tab code can’t currently cope with defineESModuleGetters. The patches are awaiting review.
- workers can’t currently run ES modules.
- There’s an #esmification Matrix room for questions and coordination
- Check out this walkthrough to see how to do one of these conversions.
- Most of the grunt-work is automated with `./mach esmify`!
- Resources links:
- Lightning talk slides on how to do ESMification
- Are we esmified yet? website
- The phase 1 explainer document
- dev-platform emails on ESMification by Arai: [1][2][3]
- Example transformation
Lint, Docs and Workflow
- All node_modules directories should now be excluded from our linters. Previously, if you installed node_modules locally for particular directories, the linters may have picked up issues in those directories.
- Arai has reworked our frame-worker ESLint environment into multiple environments more suited to the different types of environments that we have around the tree. These are now listed on the ESLint documentation page on firefox source docs.
Picture-in-Picture
- Janvi is very close to landing her patch to fix hover states and add tooltips for the player window controls!
- Janvi also added a site-specific wrapper to support subtitles/captions for Voot videos
Performance
- hiro and florian closed out this bug which can cause the compositor to run at 60hz at all times even when nothing is animating on Windows!
- emilio made chrome windows support document.visibilityState, which means the refresh driver is now throttled in fully occluded background windows.
Performance Tools (aka Firefox Profiler)
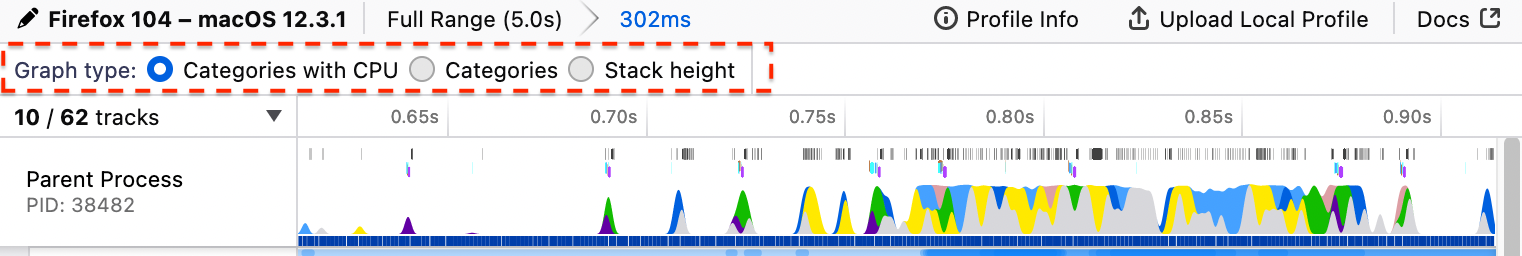
- Removed the timeline graph type radio buttons (#4147)
-
Before
-

After!
- If you are a power user and would like to use another timeline graph type, you can call window.toggleTimelineType from the devtools console with various types. See the console message in profiler.firefox.com for more details.
-
- Profiler no longer crashes when the profile data is too big, instead we discard only the profile of the child process that was too big, and we log error messages in the JSON file. It’s visible in profile.profileGatheringLog from the console. (Bug 1779685, Bug 1758643, Bug 1779367)
- Added a power profiling setting to the profiler popup (Power usage data in Watt is available only on Windows 11 with Intel CPUs and Apple Silicon, but the preset can still be used elsewhere for a low overhead profiling of what’s causing thread wake-ups) (Bug 1778282) You can change the profiler setting either via profiler popup or about:profiling.
-
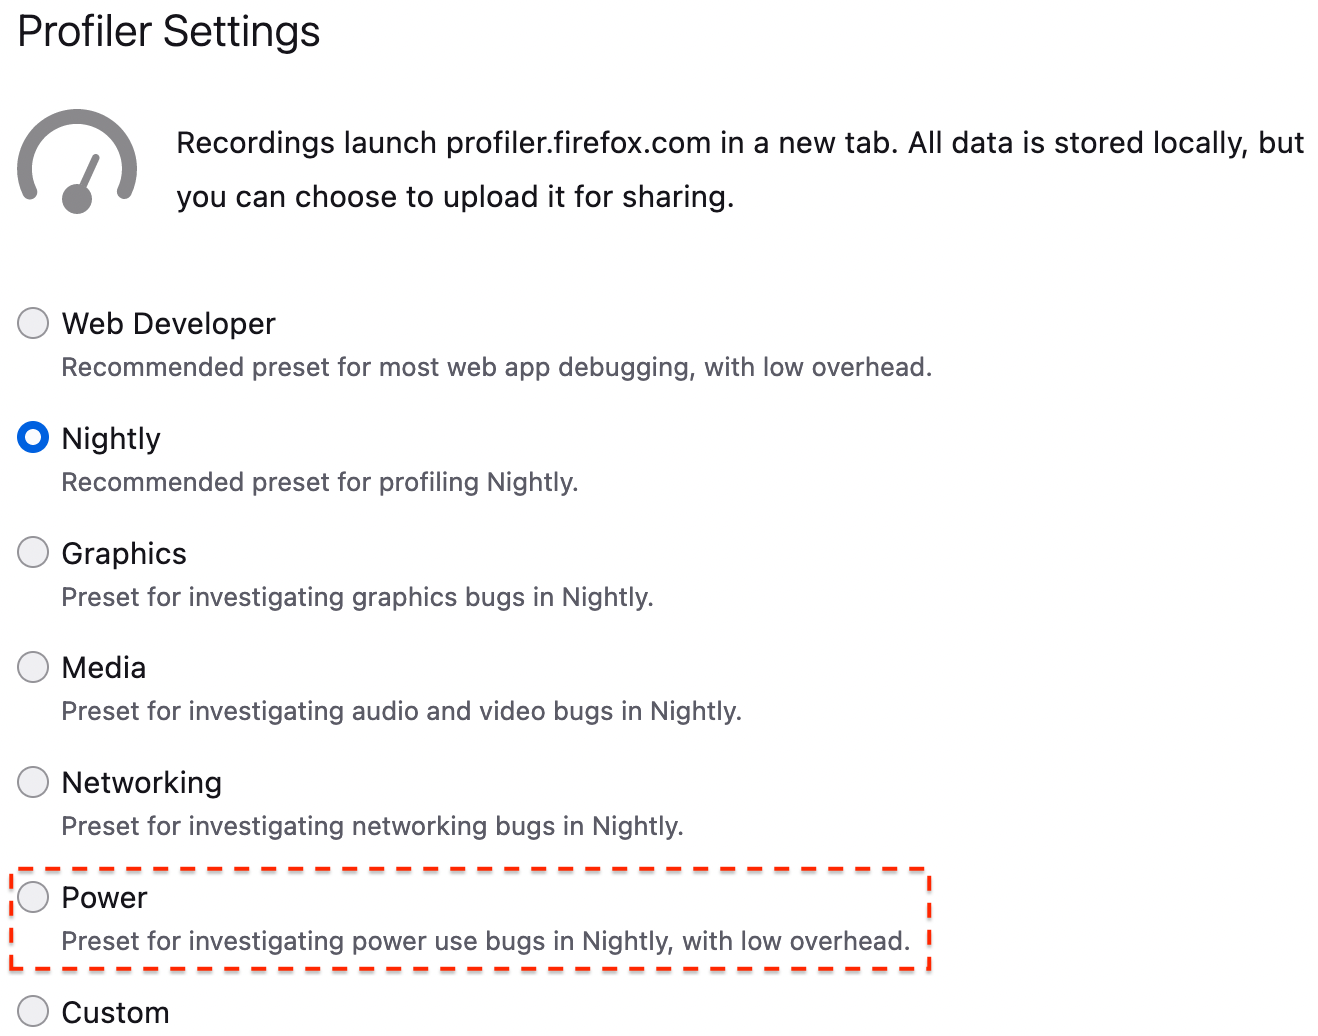
This will be very handy for finding power consumption optimizations!
-
- Added profiler sub-category for Wasm frames (Bug 1780383)
- Added doc for local profiling on android with screenshots. Here’s the link to the doc. (#4145)
- Hid the user interface components showing stacks for tracks that don’t have stack samples (#4133)
Search and Navigation
- :jteow changed the default behavior of the URL bar to no longer automatically fixup http addresses
- :adw fixed an issue with adaptive autofill where a host with a prefix like www would not autofill if you re-typed the host in http:// without www
- :daisuke is modifying the Places database to support the Sponsored Tile Offboarding effort
- :standard8 migrated files to ES6 Modules, specifically relevant files in toolkit/components/search and browser/components/search and changed some search consumers to use ESM imports directly. He also modified a couple excluded search files to now be included in the rejected-words linter
No comments yet
Post a comment