Highlights
- Dale Harvey implemented an experimental Quick Actions feature in the Address Bar
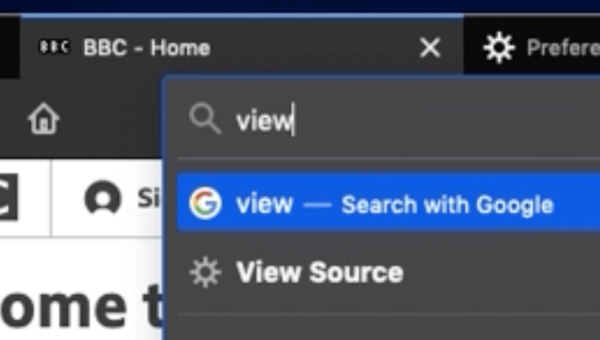
Quick Actions such as “View Source” are available in the address bar when enabled.
-
- Demo video: directly open privacy preferences, view source, take screenshot
- Enable browser.urlbar.quickactions.
enabled and browser.urlbar.shortcuts. quickactions - This is en-US only for now (Bug 1699316)
- CSS color-mix function support was added to developer tools via the layout.css.color-mix.enabled pref
- Display function in rule view autocomplete (Bug 1778396)
- Display color swatches for color-mix params (Bug 1695382)
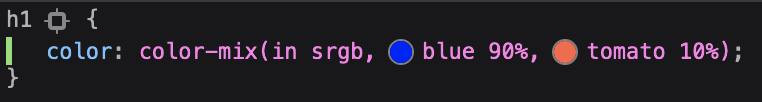
color-mix takes in two color values and mixes them by a given amount.
- Thanks to evilpie, we now show entries for URLSearchParams instances in the console and debugger
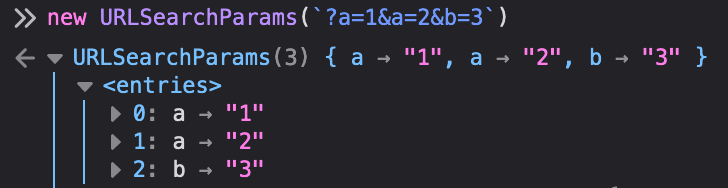
URLSearchParams can now be previewed when desired.
- Thank you to m_kato who added a pip wrapper to support subtitles for Disney+!
- This is currently scheduled to go out in Firefox 104!
- The Search team has published a document about how adaptive autofill works in the AwesomeBar in Firefox. Lots of detail there on how that feature works, and various prefs for controlling it.
Friends of the Firefox team
Resolved bugs (excluding employees)
Volunteers that fixed more than one bug
- Itiel
- Michael Kohler [:mkohler]
New contributors (🌟 = first patch)
- 🌟 In the Firefox Profiler, first-time contributor Bhavya Joshi fixed github issue #4099 (see below for more information)
- Daniel Qeli fixed/improved alignment of “Learn more about performance” button with cache headers
- manekenpix removed defer usage in devtools\client\shared\test\
helper_addons.js - Raphaël Ferrand applied new classnames as you type in the .cls section of the rule-view
Project Updates
Add-ons / Web Extensions
WebExtensions Framework
-
Extension CSP is now also applied to WebExtensions Workers – Bug 1685627
Developer Tools
- Raphael added an inactive notice when `border-image*` is used on internal table elements where `border-collapse` is set to `collapse` (Bug 1583910)
- Julian fixed an issue which was causing blank DevTools when debugging some WebExtension (Bug 1777296)
- Opening the Browser Console will no longer cause scripts to pause on `debugger` statements (Bug 1766128)
- Bomsy added a button to remove all breakpoints in the Debugger (Bug 1742774)
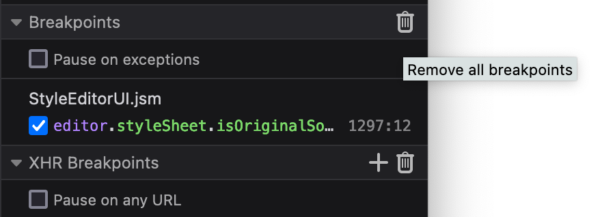
Too many breakpoints? Clear them all with the click of a button.
- Alex is working on making the Debugger SourceTree code faster and easier to understand (see Bug 1777203 and blockers)
-
The slow script warning toolbar was fixed and the “Debug” button will now be visible when you have DevTools opened, on all channel (Bug 1774937)
- Picture-in-Picture
- Niklas has been working on fixes for the cc button on the PiP window (Bug 1775334, Bug 1778287)
- mhowell updated the first time toggle description for the PiP toggle + made the toggle wider so that there are less lines of text (and less likelihood to visually overlap with other controls)
- mconley fixed an issue where the “Skip Ad” overlaps with PiP button
- janvi has been working on hover states for PiP, which will be landed soon!
- Performance
-
florian and hiro have been working together to reduce power consumption from a panels bug which causes Windows machines to composite at 60hz even after panels have closed.
- Performance Tools (aka Firefox Profiler)
-
Add a “Power Use” feature (Bug 1774844).
From about:profiling it’s now possible to enable the “Power use” feature before starting the profiler: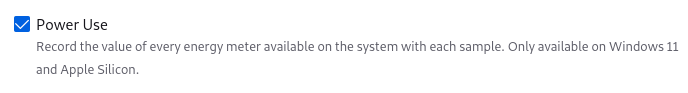
New feature inside about:profiling, named “Power Use”.
- Then in Apple M1 and Windows 11 we can see the power usage during profiling:
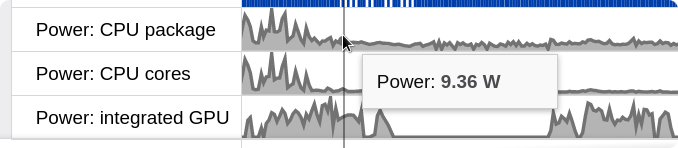
Inside the profiler, there are new tracks showing power usage, with a tooltip showing the instant power usage.
-
- This example comes from this profile: https://share.firefox.dev/
3nNc2xSTake care to disable sampling with the “nostacksampling” option to have good measurements (soon a preset will be added to make it easier to make this work best (bug 1778282)).
This is some huge work done by Florian Quèze.
- This example comes from this profile: https://share.firefox.dev/
-
Add a pen icon to indicate profile names are editable (github issue #4099 by first-time contributor Bhavya Joshi 🎉🎆)
The pen icon for profile names
- More label frames: bug 1749521, bug 1776721, bug 1777473. This exposes:
- more browser internals with understandable names to javascript developers (Style Computation, CSS Parsing, Layout tree destruction)
- Most javascript APIs implemented in C++ from: String, Object, TypedArray, Number, Date, Intl, RegExp, Map, Set, Reflect, JSON, BigInt, Array.
- This makes the profiler much more useful for JS developers.
- Fix the buffer size handling when reaching the configured maximum size. Previously we had a bug where the buffer size would always increase, eventually causing an OOM crash.
- LUL initialization on Linux has been optimised – but still more to come!
Search and Navigation
- James Teow has disabled the “Did you mean to go to <site>“ notification bar, which was quite annoying for users having a wildcarded DNS server, resolving any word to an helper page. It can be re-enabled setting `browser.urlbar.
dnsResolveSingleWordsAfterSear ch` to 1. Bug 1735534 - Michael Kohler made the Remove button disabled for the default Search Engine, that can’t be removed anyway. Bug 1761513
- Mandy Cheang is refactoring part of the Search Service to improve maintainability and robustness: Bug 1777278, Bug 1777599, Bug 1777632
- Daisuke Akatsuka has corrected a regression where autofill could duplicate the protocol. Bug 1778335
No comments yet
Post a comment