Shadow DOM and Web Components are enabled by default in Firefox 63 and the Developer Tools are ready for them ! If you are using Web Components in your project, or want to experiment, download Nightly, and check out how we integrated these new technologies into the Inspector and Debugger 🙂
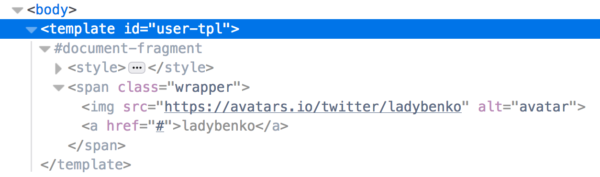
<template> elements, which are useful to create the internal Shadow DOM structure of a custom element, can now be inspected as you would inspect other types of nodes.
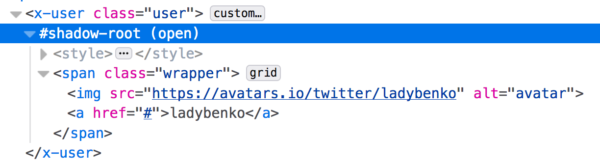
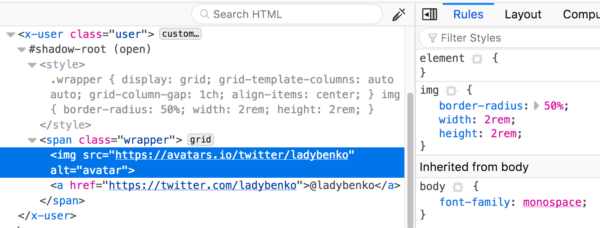
The Shadow DOM inside an element can also be inspected. Look for a #shadow-root node in the Inspector –and note that the mode (closed or open) it was created with is indicated as well.
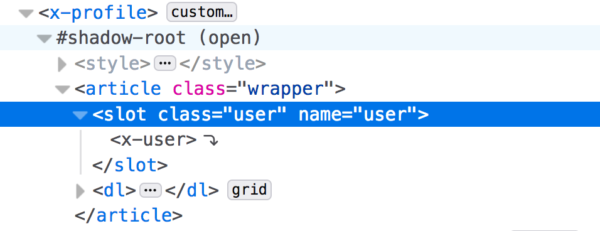
If your Shadow DOM contains slots, you can inspect those as well!
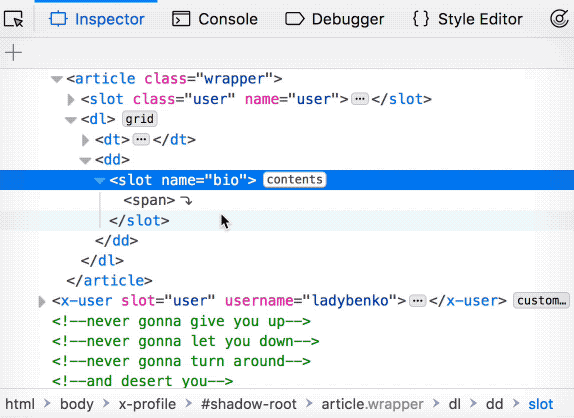
And as a nice bonus, if you click on the arrow icon on a slotted node, you will jump to the location of the original node:
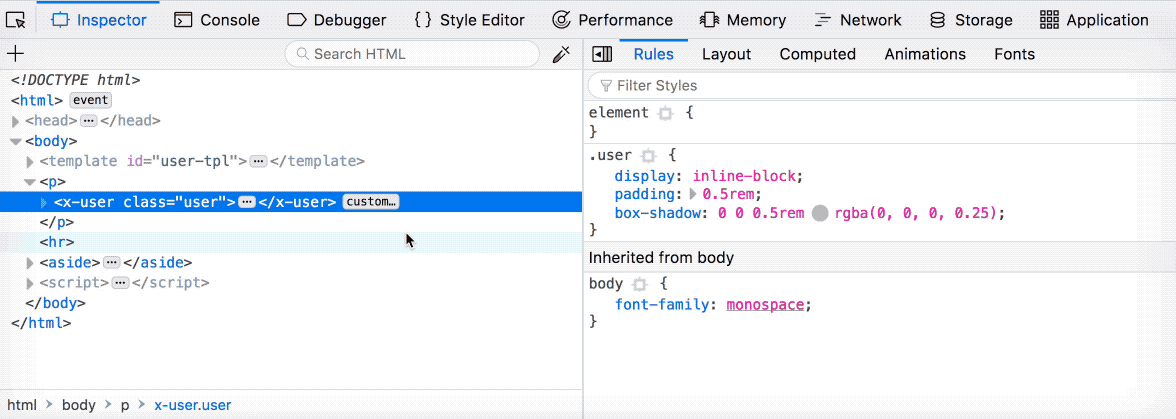
And speaking of jumping, if you would like to jump from a custom element in the Inspector to its definition in the Debugger, you can do it by clicking the custom… badge besides the element:
Lastly, you can see how the CSS cascade affects the Shadow DOM, modify styles, inspect the layout, etc. in the CSS pane on the right side of the Inspector.
We hope that helps you with your Web Components work. As always, we are trying to improve the Developer Tools –you can peek at what is coming next here. And if you find a bug, or have some suggestions or feedback, you will be more than welcome to share them in DevTools’ Slack community or IRC channel.
Happy coding!
No comments yet
Post a comment