Highlights
- The new Screenshots component (which replaces the Screenshots built-in extension) is now enabled by default on Nightly (bug 1789727)! This improves upon the extension version of the feature in a number of ways:
- You can capture screenshots of about: pages and other pages that extensions cannot normally manipulate
-
- Improved performance!
- Greatly improved keyboard and visual accessibility
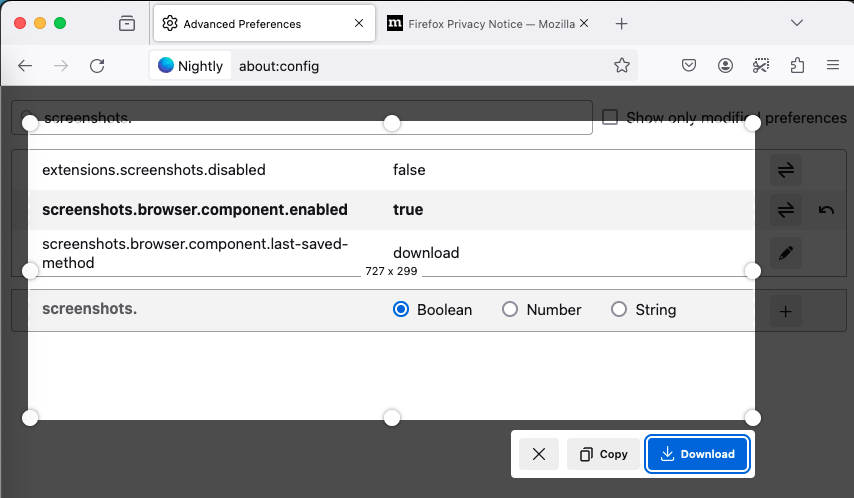
- You can ensure it’s on by default by checking if screenshots.browser.component.
enabled is set to true in about:config - Found issues with the new component? File them here!
- You can access the Screenshot feature via the keyboard shortcut (ctrl + shift + s or cmd + shift + s for macos), the context menu, or by adding the Screenshot button to your toolbar via toolbar customization
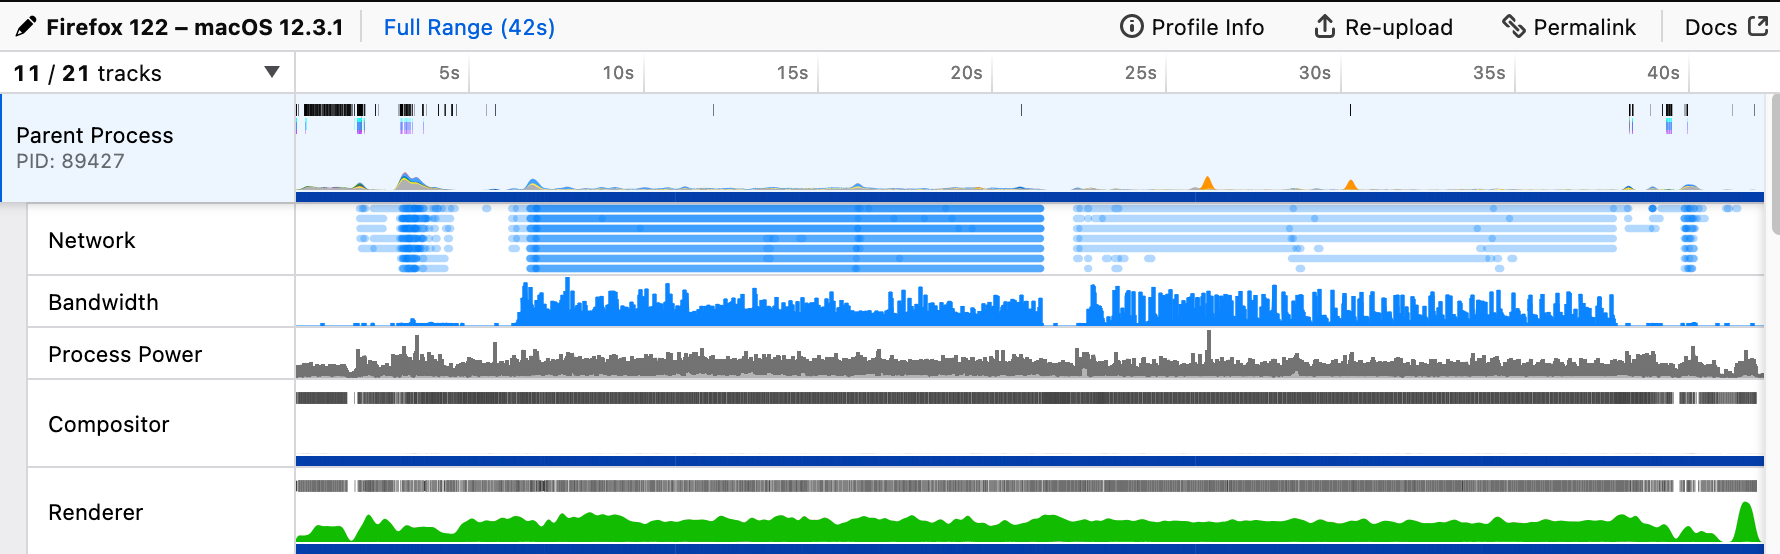
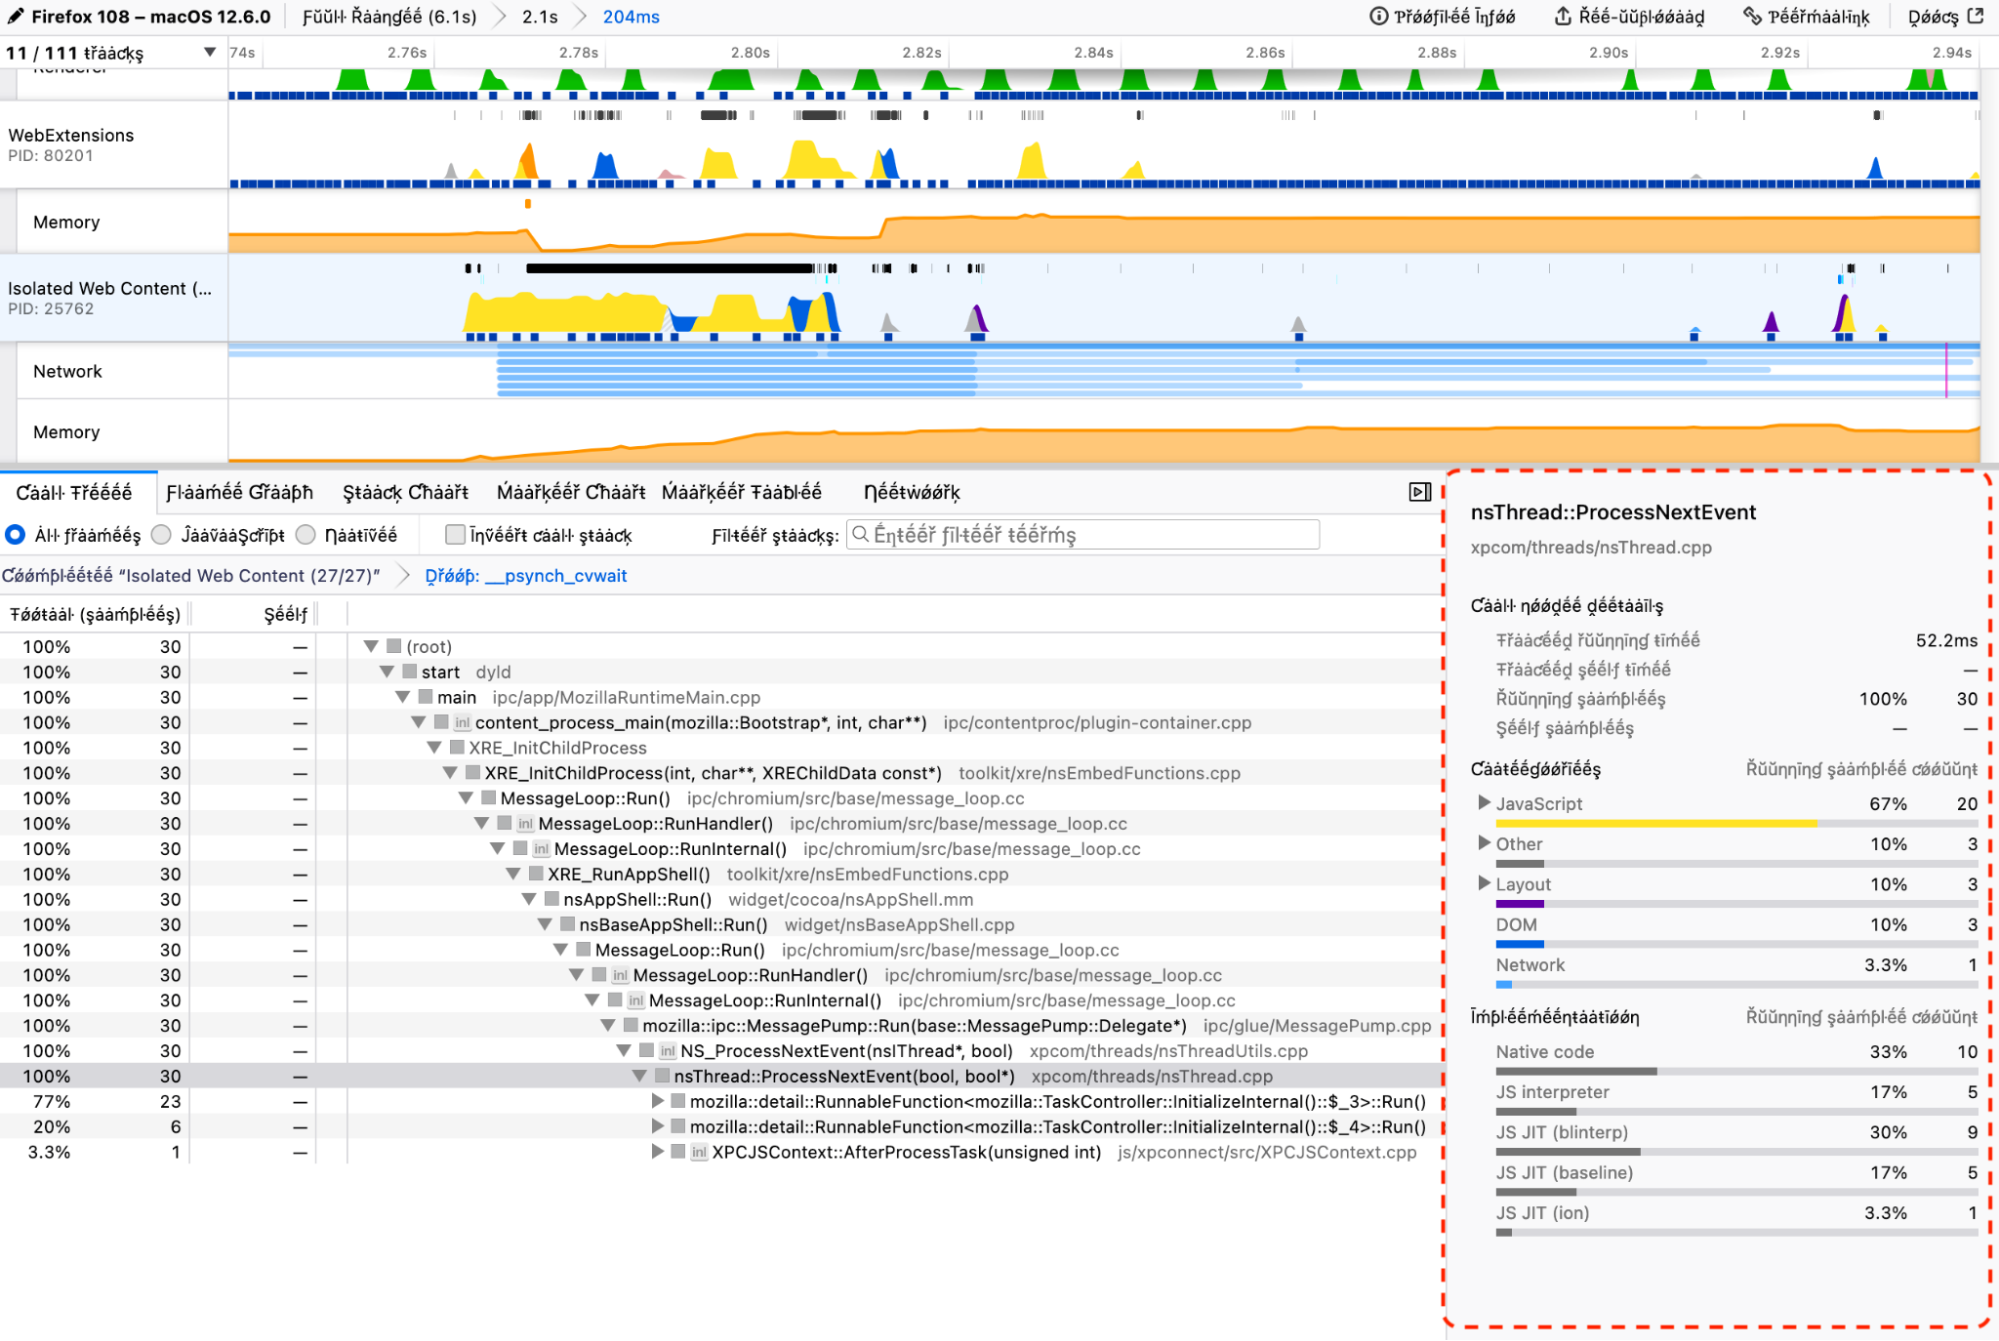
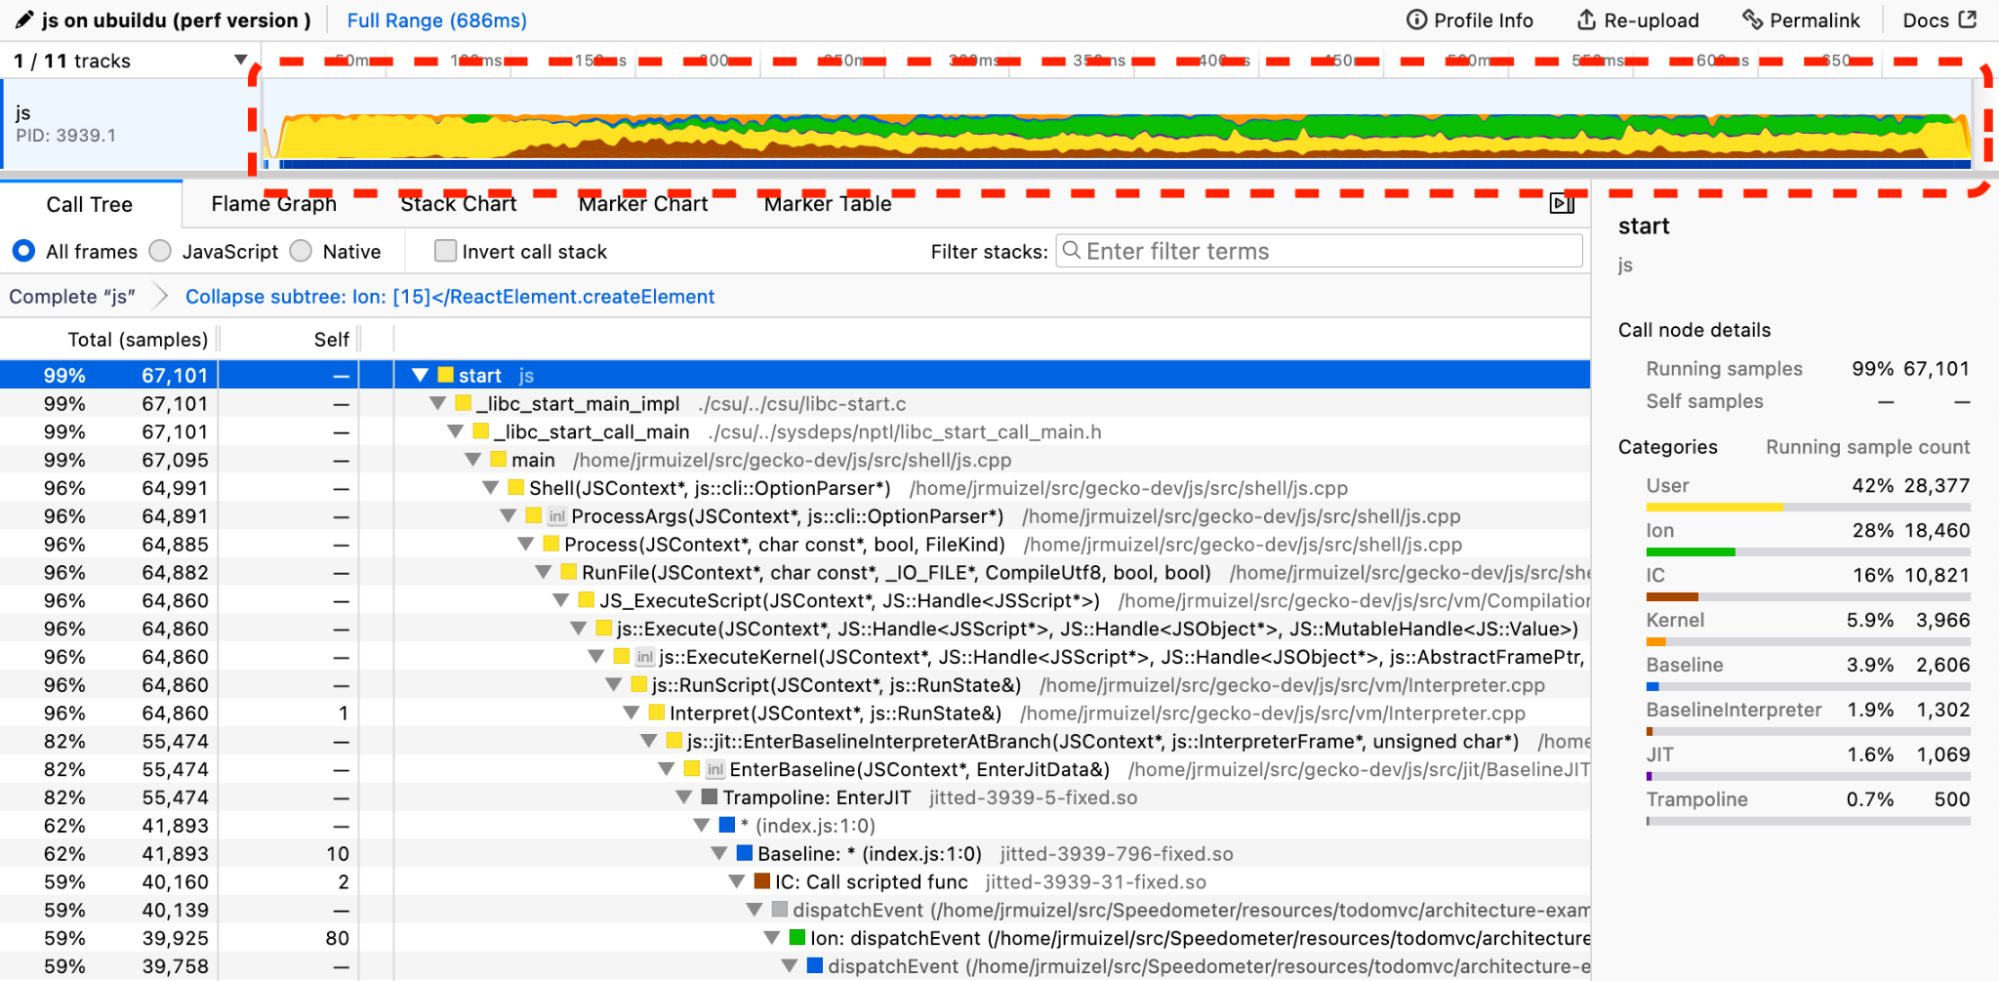
- The Firefox Profiler has a new “Network Bandwidth” feature to record the network bandwidth used between every profiler sample. Example profile
- Florian gave a FOSDEM talk about the Firefox power profiling
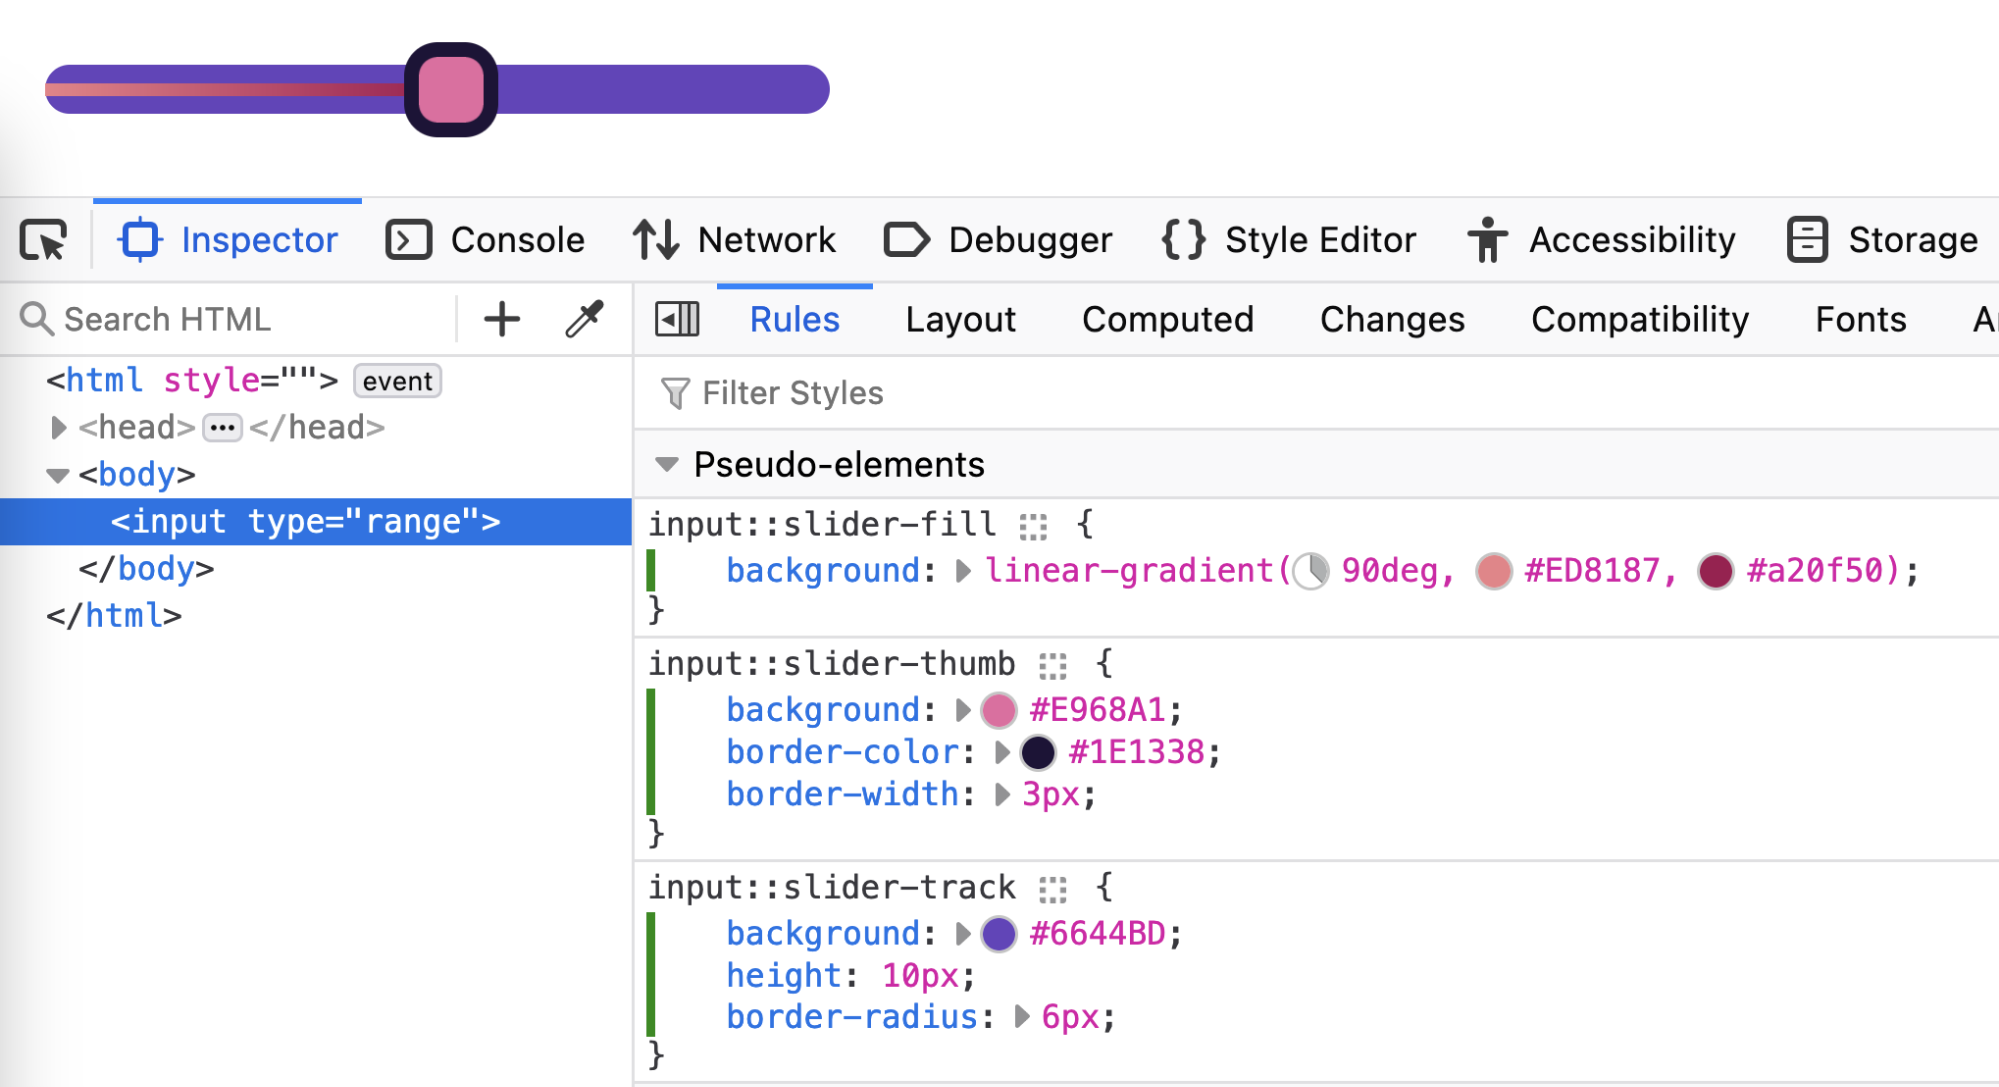
- Nicolas added support for incoming input[type=range]::slider-* pseudo elements (bug)
- behind layout.css.modern-range-
pseudos.enabled
- behind layout.css.modern-range-
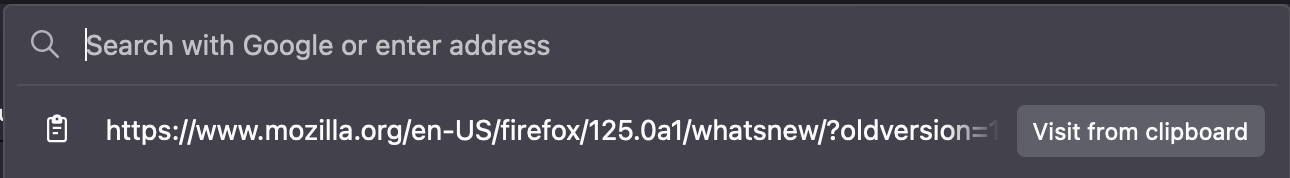
- Karandeep made a clipboard feature for the address bar. Currently, we plan to ship this enabled by default in Firefox 125!
Friends of the Firefox team
Resolved bugs (excluding employees)
Script to find new contributors from bug list
Volunteers that fixed more than one bug
- Bojidar Marinov [:bojidar-bg]
- Nikki Bernobic [:echrs]
New contributors (🌟 = first patch)
- 🌟 Artem Manushenkov changed Watch expressions input field placeholder from “Add watch expression” to “Add expression”
- 🌟 Bojidar Marinov [:bojidar-bg] updated about: pages to use OTHER_LOCAL instead of HISTORY and added about:settings as alias of about:preferences
- 🌟 Patrycja Rosa [:ptrcnull] (she/her) to use c_int as ptrace request type on musl libc
- Nikki Bernobic [:echrs] added a storybook story that shows an example of Moz Message Bar with a Heading plus Message and removed Deprecated.sys.mjs
Project Updates
Developer Tools
DevTools
- Arai fixed an issue where ReadableStream.values() was eagerly evaluated (bug)
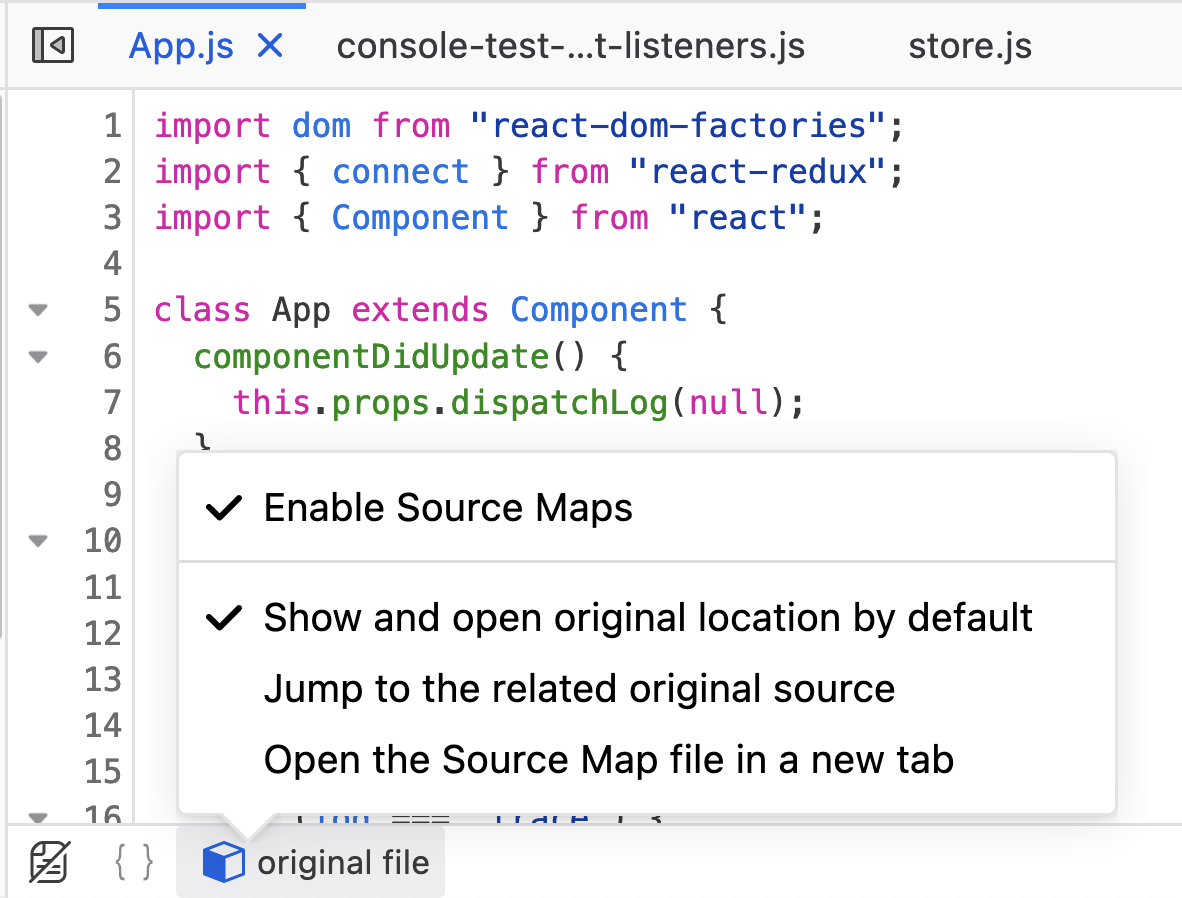
- Alex added a button dedicated to source map settings in the editor footer (bug)
- By popular demand, Alex added back the preference to control the Debugger Pause Overlay (bug)
- set devtools.debugger.features.
overlay to false if you want to disable it
- set devtools.debugger.features.
- Alex fixed performance issues in the debugger when a page had a lot of sources (bug)
- Hubert fixed an issue in the debugger where the Outline view wouldn’t populate (bug)
- Julian fixed opening relative URL of <img> on pages with a <base> (MDN) tag (bug)
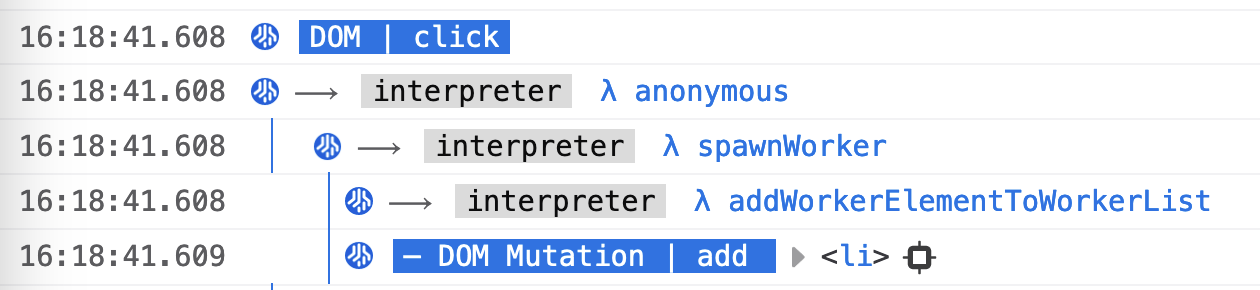
- Alex added an option in the tracer to track all DOM Mutations (bug)
- from the console :trace –dom-mutations
- (Set devtools.debugger.features.
javascript-tracing to true to enable the tracer)
WebDriver BiDi
- Thanks to Kagami who implemented set_permission for marionette driver (bug)
- Sasha implemented the storage.deleteCookies command for WebDriver BiDi. (bug)
- Sasha added support for the userContext field of the partition parameter for storage.getCookie and storage.setCookie commands. (bug)
- Julian implemented a basic version of the network.provideResponse command. (bug)
ESMification status
- ESMified status:
- browser: 100%
- toolkit: 99.83%
- This one is being fixed here
- devtools: 89.29%
- dom: 96%
- This one is being fixed here
- services: 98.94%
- Only 10 JSMs left in the tree!
- Total: 99.35% (+0.00% from last time)
-
#esmification on Matrix
Lint, Docs and Workflow
- :Mossop, :Gijs and Standard8 met and discussed the remaining rules (and a few others) that are recommended by ESLint but that we haven’t enabled yet.
- no-useless-escape has been turned off, as the work to enable it would have been significant, and it doesn’t catch any real errors.
- getter-return, no-constant-condition and no-case-declarations have all been turned on.
- object-shorthand has been enabled on the debugger code.
- no-console is to be enabled soon for production code.
- no-shadow is also on the list to enable for production code (with various exceptions)
- no-use-before-define is also likely to be enabled with a limited set of options
- :Mossop is working on enabling argument linting from no-unused-vars. 47 patches have already landed, 11 to go!
- :Gijs has enabled a new rule to prevent comparison or assignments within ok() assertions in tests.
- The ESLint configuration has been changed so that all .jsx files are now assumed to be ES modules.
- Pocket’s files that are modules have been renamed to use .mjs extensions
Migration Improvements
- We’ve started early investigations on a profile backup feature. This feature will, in theory, allow users to create backups of their user profile in an archive on the local file system. We’re still very early days here, but we have a meta bug here that people can follow along with.
New Tab Page
-
We’re in the early phases of building out an experiment that lets people set wallpapers on about:home/about:newtab. Stay tuned!
Performance Tools (aka Firefox Profiler)
- Made the call tree sidebar localizable.
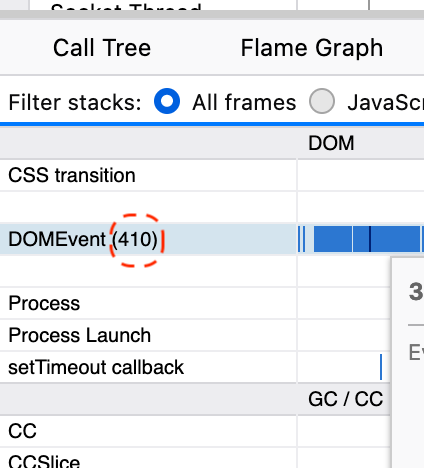
- Marker count is shown next to the marker name in the marker chart when a marker is hovered.
- Improved performance of the marker chart when there are so many overlapping markers.
-
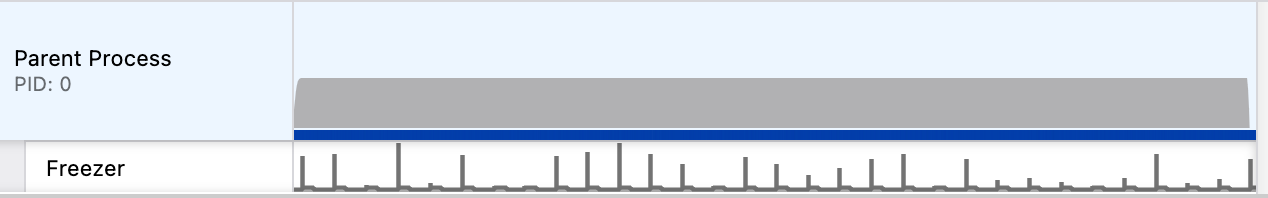
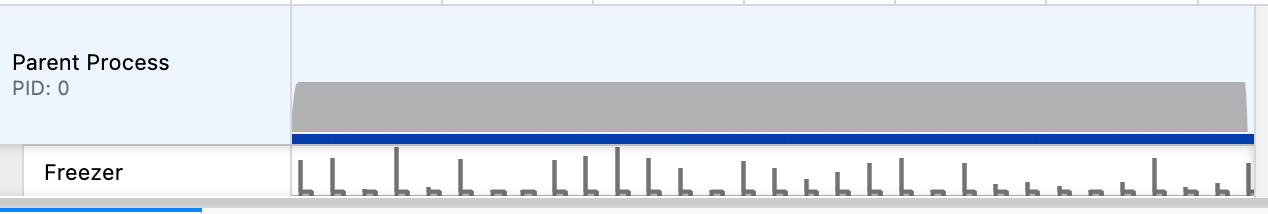
Improved the power graph and made it easier to see very small values in the graph by hiding the zero values.
- Before:
- After:
- Fixed the hittesting on the activity graph.
- Fixed the marker stacks that were broken because of a symbolication issue.
Search and Navigation
- Work continues on Consolidated Search Configuration and improvements from mcheang and standard8)
- General Improvements
- Switch-to-tab container improvements (marc & mak)
- Bug 1880066 – Switch-to-tab container icons are blurry on Windows/Ubuntu
- Bug 1880069 – Switch-to-tab in a regular tab loads the url already opened in container tabs
- Bug 1880078 – Previously opened container tabs are still shown in the Tabs/Firefox suggest section after a browser restart
- Last week was Marc Seibert’s (Berlin Student) last week at Mozilla. Thanks Marc for all your contributions to Firefox throughout the year. 🎉
- Work continues on Cross-Platform Suggest from adw, daisuke, and karandeep. These fixes include:
- Yelp suggestions, improving the suggestion feedback button, fixes to weather suggestion
- Urlbar.impression telemetry removed that is no longer needed
- Work continues on Search and SERP telemetry categorization from scunnane and jteow
Storybook/Reusable Components
- Thanks to :echrs for adding a story to moz-message-bar
- Thanks to :kcochrane for creating the moz-page-nav component
- :mstriemer landed the moz-button component
No comments yet
Post a comment