Highlights
- OOP iframes somewhat work now on Nightly!
- For the super-brave, you can test it yourself by creating a boolean preference fission.autostart and setting it to true, and then restarting Firefox
- Please file bugs that you find against this metabug
- Expect general instability for the next little while
- Event Breakpoints enabled on Nightly, allowing you to break on specific event type (e.g. mouse click).
-
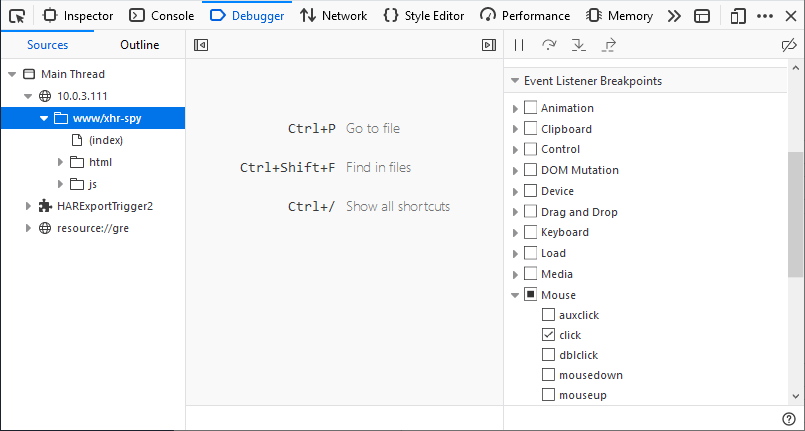
Not sure where your click events are being handled? An Event Listener Breakpoint will help you track that down by letting you break on any click event, and stepping through each listener!
-
- Blocked resources are displayed in the Network panel (rendered in red and using new status label) (platform bug, DevTools meta)
-
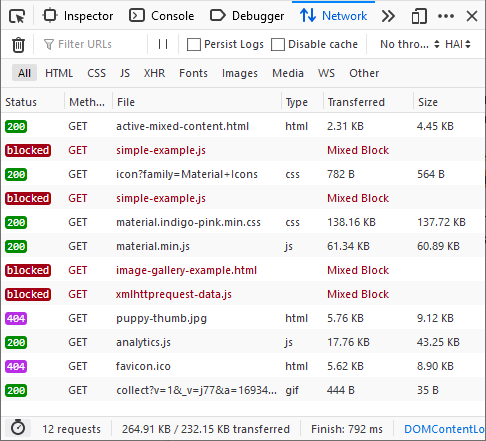
The blocked resources are highlighted in red.
-
- AVG blocked our access to logins.json and broke our password database for some of our users. We released an add–on, heartbeat message, and a SUMO article to help users recover from the data loss. Thanks to everyone who helped with this effort!
- The flow for publishing Gecko Profiler performance profiles is streamlined! In addition, the profiler now accepts gzipped profiles from Firefox, letting us send larger profile data from addon (it was a problem because of the IPC data limit)
-
Sharing profiles with Firefox developers recorded during slow times helps us investigate and fix performance problems.
-
Friends of the Firefox team
Resolved bugs (excluding employees)
Fixed more than one bug
- Bryan Kok [:transfusion]
- Chujun Lu
- Florens Verschelde :fvsch
- Heng Yeow (:tanhengyeow)
- janelledement
- jaril
- Karan Sapolia
- Kestrel
- Masatoshi Kimura [:emk]
- Michael Krasnov
- Miriam
- premk
- Thomas
- Tim Nguyen :ntim
New contributors (🌟 = first patch)
- 🌟 Armando Ferreira cleaned up some of our DevTools folders
- Miriam made it so that we use proper plural forms in the Debugger, and improved the contrast of the selected text in the Debugger when hitting a breakpoint or inspecting collections!
- 🌟 Bren Louis Surio helped us get rid of an obsolete Telemetry probe
- 🌟 Bryan Kok [:transfusion] made it so that the nascent “editor mode” for the DevTools Web Console causes commands to execute when pressing Ctrl/Cmd-Enter, and also made sure that we show the line number gutter in that mode.
- 🌟 Christoph Walcher made it so that we show download progress on macOS in the Finder!
- Chujun Lu made it so that conditional breakpoints in the DevTools debugger don’t automatically break on exceptions, made it that Logpoint errors actually get logged as errors instead of strings, and avoided a collision with one of our keyboard shortcuts in the debugger (Goto line is now Ctrl-G)
- 🌟 danielvictoriadbugzilla added some handy inline documentation to some of our Telemetry code
- 🌟 danner.simon made it so that the “Clear Downloads” button can be tabbed to in the Downloads Library viewer on non-macOS platforms
- 🌟 Dickson Tan fixed a focus glitch in the DevTools Web Console when using the NVDA screenreader tool
- 🌟 Francis Houle improved some of the built-in documentation for about:debugging
- Gautham Velchuru fixed a visibility problem in the Tracker Blocking panel when using High Contrast mode
- Herpiko Dwi Aguno fixed an issue where focus wouldn’t be given to the DevTools sometimes
- 🌟 hgallagher inserted some MPL2 license headers where they were missing in our Telemetry code
- 🌟 janelledement made it possible to save scripts from the Debugger source list context menu (that’s a 6 year old bug!), and fixed a glitch where the find highlighter in the Debugger would break-up token highlighting in strange ways
- joseph.a.jalbert fixed some interoperability problems with our WebExtension manifest.json parser
- 🌟 kelly.bell made it so that the Web Console filter buttons appear inline if the window is wide enough
- 🌟 Martin Matous added support for byExtensionId and byExtensionName to the Downloads WebExtension API
- Michael Krasnov modernized some of our tests to use a shared TestUtils.waitForCondition function, and similarly updated some of our WebExtension tests to use more modern testing idioms
- mihir17166 made it so that it’s possible to both copy and move a bookmark in the Bookmark Library after a search (that’s a 10 year old bug!)
- Myeongjun Go made it so that running an alert() inside of a WebExtension background script will no longer hang that add-on
- 🌟 premk fixed a misspelling in a preference, cleaned up some of our Search tests, added Firefox Sync information to about:support, and made it so that the Sponsored Stories preference is properly sync’d between devices
- 🌟 saijatin28 fixed a spacing issue in our DevTools UI when using an RTL build
- Thomas added more distinctive colours to our DevTools Layout Inspector tools, and added flexbox container and item information to the Inspector Picker
- Mohd Umar Alam [:umaralam48] cleaned up some of our browser CSS by referring to :root rather than the ID of the root node
- 🌟 J got rid of some dead CSS in our DevTools Inspector code
- 🌟 Ali Abdoli cleaned up some of our panel UI CSS by referring to :root rather than the ID of the root node
- 🌟 Yifei He fixed some padding in the new about:addons page
Project Updates
Developer Tools
Console
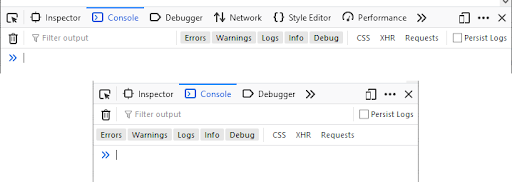
- Console responsive toolbar redesign
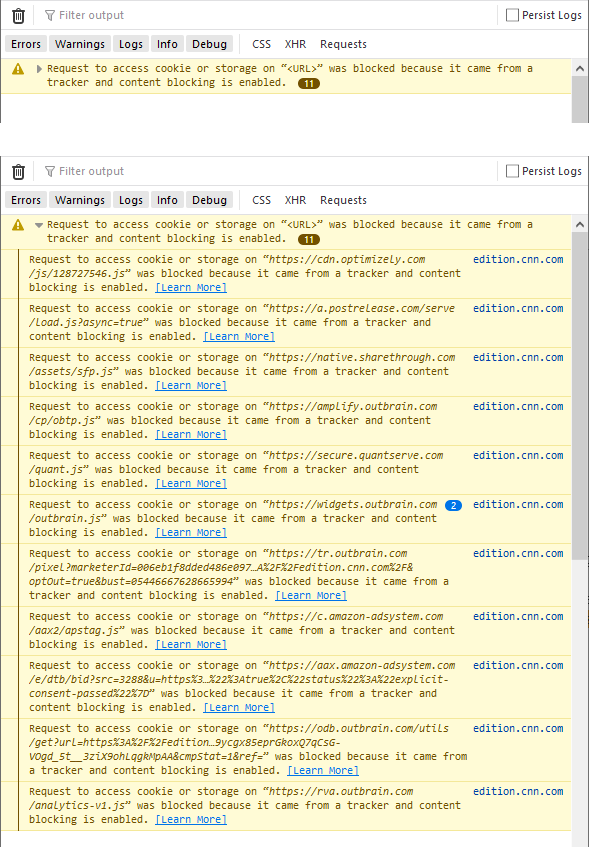
- New, better warning groups, as part of our “unclutter the Console panel” effort. Compare the amount of content in the following screenshots!
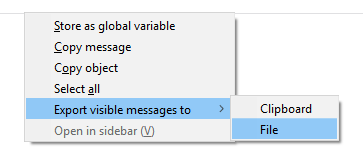
- “Export Console content to file” option available through the Console panel context menu.
Debugger
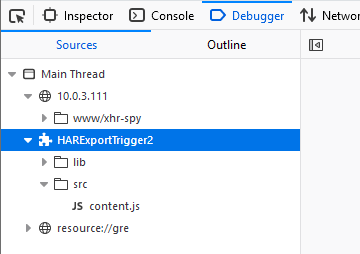
- Displaying extension name in the Sources panel (bug)
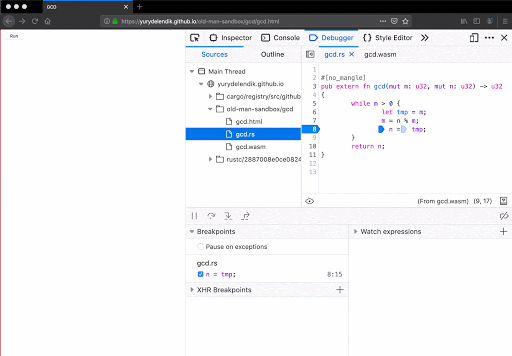
- Original Rust variables are shown. Thanks to Yury Delendik’s work on compiling dwarf metadata in sourcemaps and our existing map scopes functionality.
Inspector
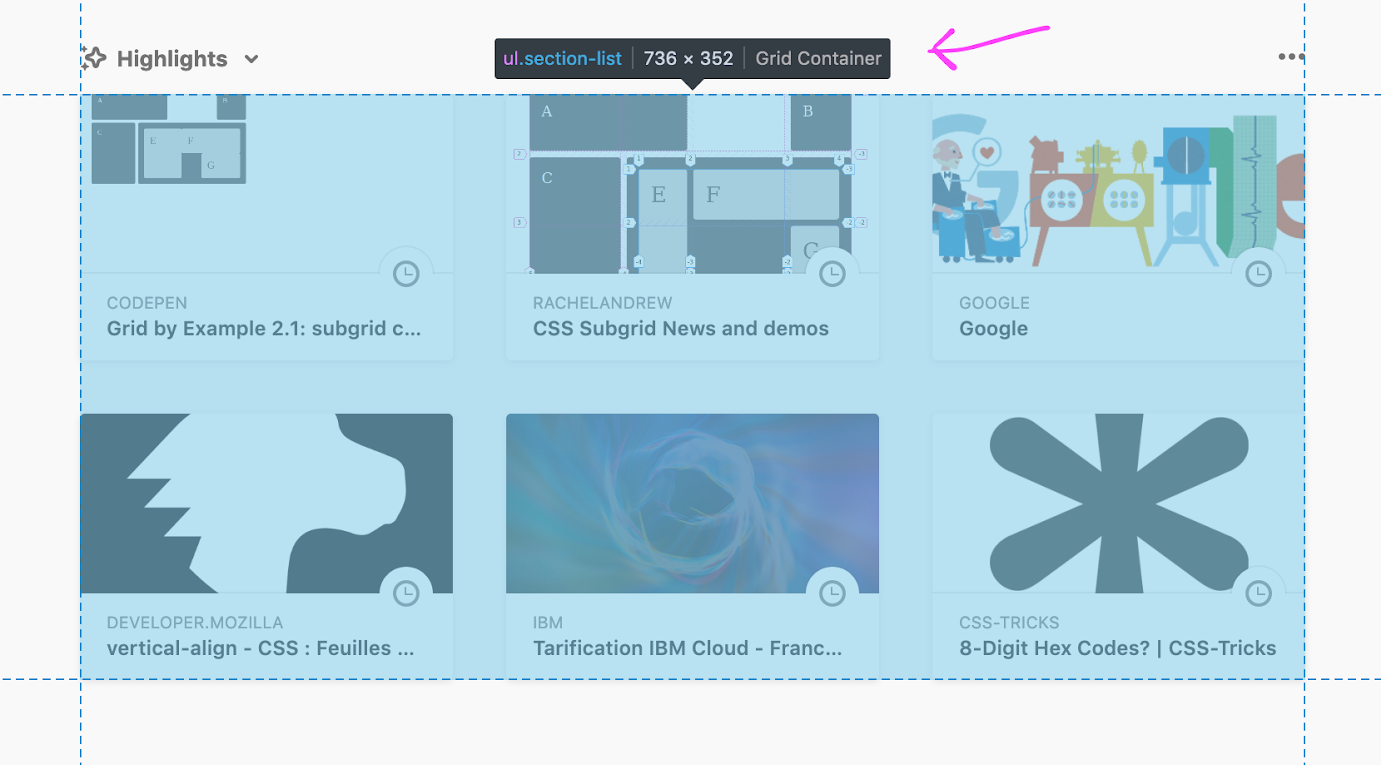
- The node infobar, displayed at the top of the highlighted area, will now display whether the highlighted element is a flex or grid container or item (bug).
- Bug 1464440 – [meta] subgrid support in grid inspector
-
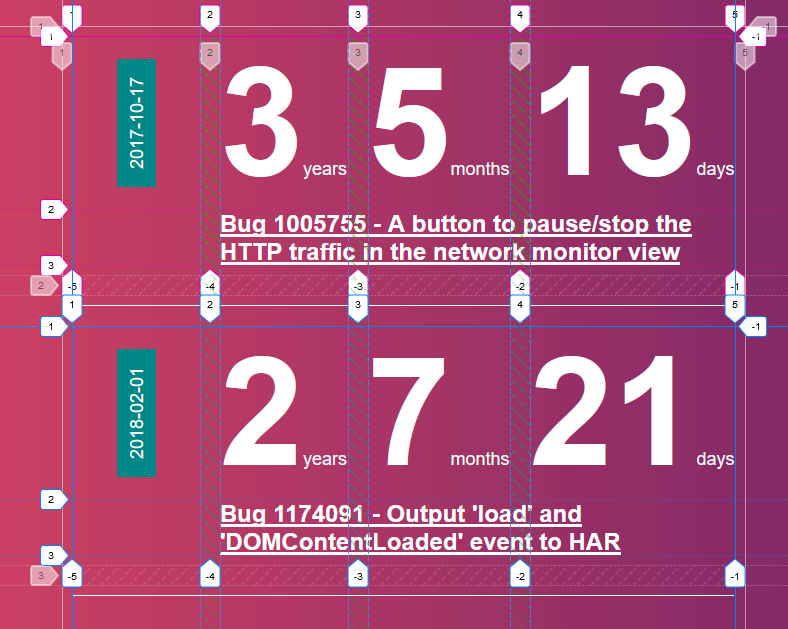
Subgrid support is coming!
-
Documentation
- DevTools documentation for 68 updated.
Fission
- Recent things that have been ported to be Fission-compatible:
- When Fission is enabled, PIDs for processes within a tab are now listed in the tab tooltip
- Similarly, you can get a subframe PID by opening the This Frame submenu on the iframe (it’s at the bottom)
-
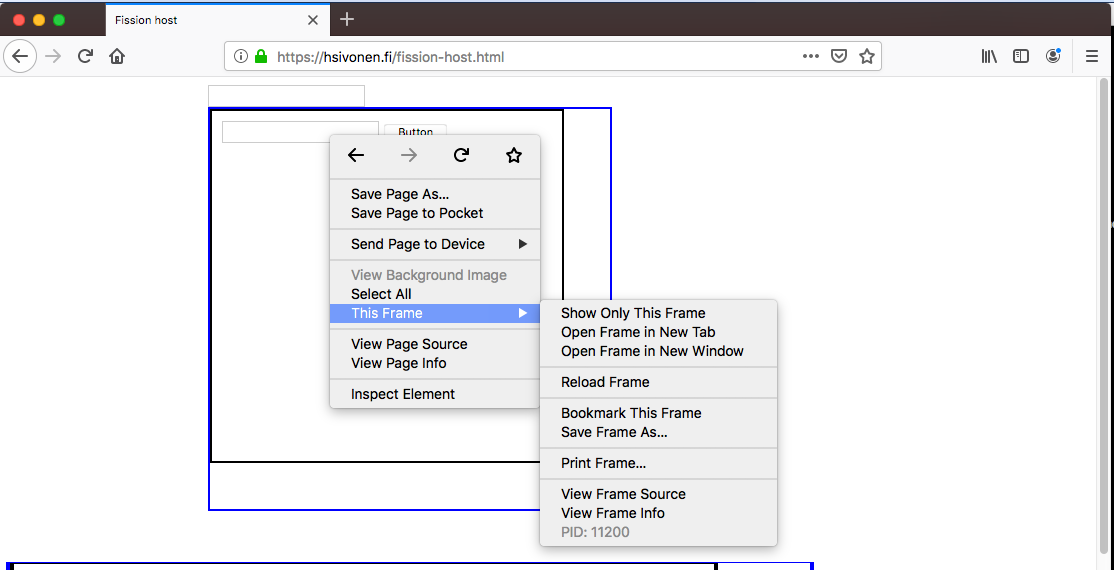
This will be very useful for Nightly hackers working on out-of-process iframes (Fission).
-
- Heads up – nsIPrincipal’s are not automatically serialized between JS Window Actors. Filed this bug to get that fixed.
- In the meantime, best to use E10SUtils.(de)serializePrincipal
- Upcoming work for this quarter:
- Add some in-tree documentation for JS Window Actors and guides on how to port
- Port the following things:
- Command updating
- DateTimePicker
- Prompts
- Logins
- Audio and Video controls
- Find Bar
- Network error pages (stretch)
- WebNavigation (stretch)
Lint
- Prettier is landing soon
- The HTML plugin for ESLint is now enabled in the configuration by default. Sublime users may need to change settings.
- ESLint is now enabled to some level for almost all of mozilla-central
- There’s just three dom/ directories left (all WIP).
- For the directories we recently enabled ESLint, we enabled it but disabled the rules that were failing.
- We’ll have more mentored bugs to enable those rules once prettier has landed.
- ESLint 6 is likely to land soon after prettier. There’s better support for configurations which will help with auto-fixing across the entire tree, as well as a few new rules.
New Tab Page
- Consolidated multiple Bugzilla components to just “New Tab Page”
- Switched to 7 rows of Pocket articles and turning on by default for US in 69
- Restored Highlights under Pocket section for new layout
- Migrated new tab page content to fluent!
- Also migrating Home preferences and (old/control) about:welcome
Password Manager
- `origin` and `formActionOrigin` properties are now appropriately named in nsILoginInfo. Their old names are still supported for backwards compatibility.
- eTLD+1 matches for the same subdomain should appear before other subdomains
Performance
- Mandy removed a bunch of needless main-thread IO that we do on start-up when trying to access the profile directory by caching the nsIFile the first time we access it, and skipping needless Exists checks
- Gijs made it so that we collect HDD / SSD information via nsISystemInfo off of the main thread, which helps reduce the impact during start-up
- This gives us a nice platform with which to make nsISystemInfo much cheaper during start-up!
- Gijs noticed we weren’t doing PGO recording with e10s enabled, and not gathering information from the content processes. This has been fixed.
- Mandy has a patch up to reduce how much IO the crash reporter code does during start-up
- dthayer has a bunch of patches up for review to move omni.ja to lz4 compression which should be better both for disk and CPU
- Do you need to run some code before the first content process is created? There’s a new observer notification for that: ipc:first-content-process-created. This is much preferable to running any earlier, which might block first paint
- mconley working with plawless, Bas and dpalmiero to get frame recording tests infrastructure set up in a lab somewhere
Performance tools
- Added a context menu to the network panel.
-
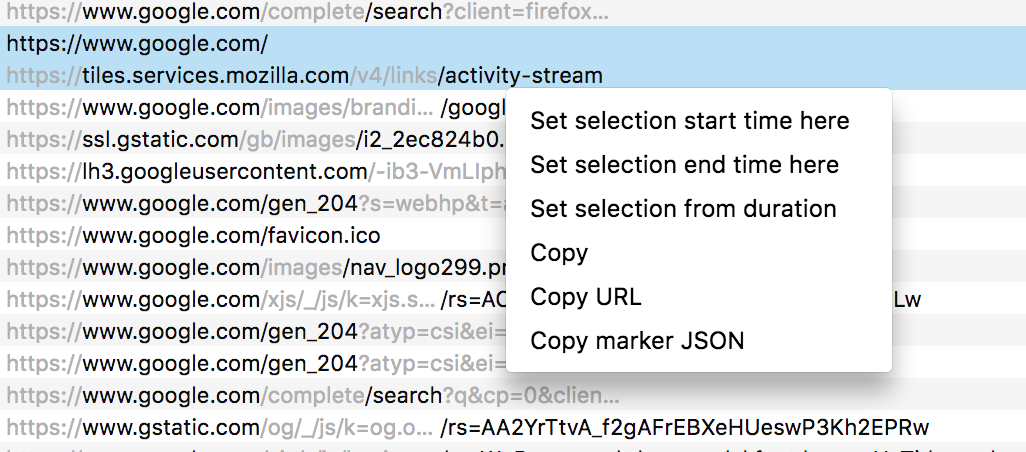
This should help make it easier for Firefox developers to navigate performance profiles and focus in on the important things.
-
- Sub category information in the sidebar
-
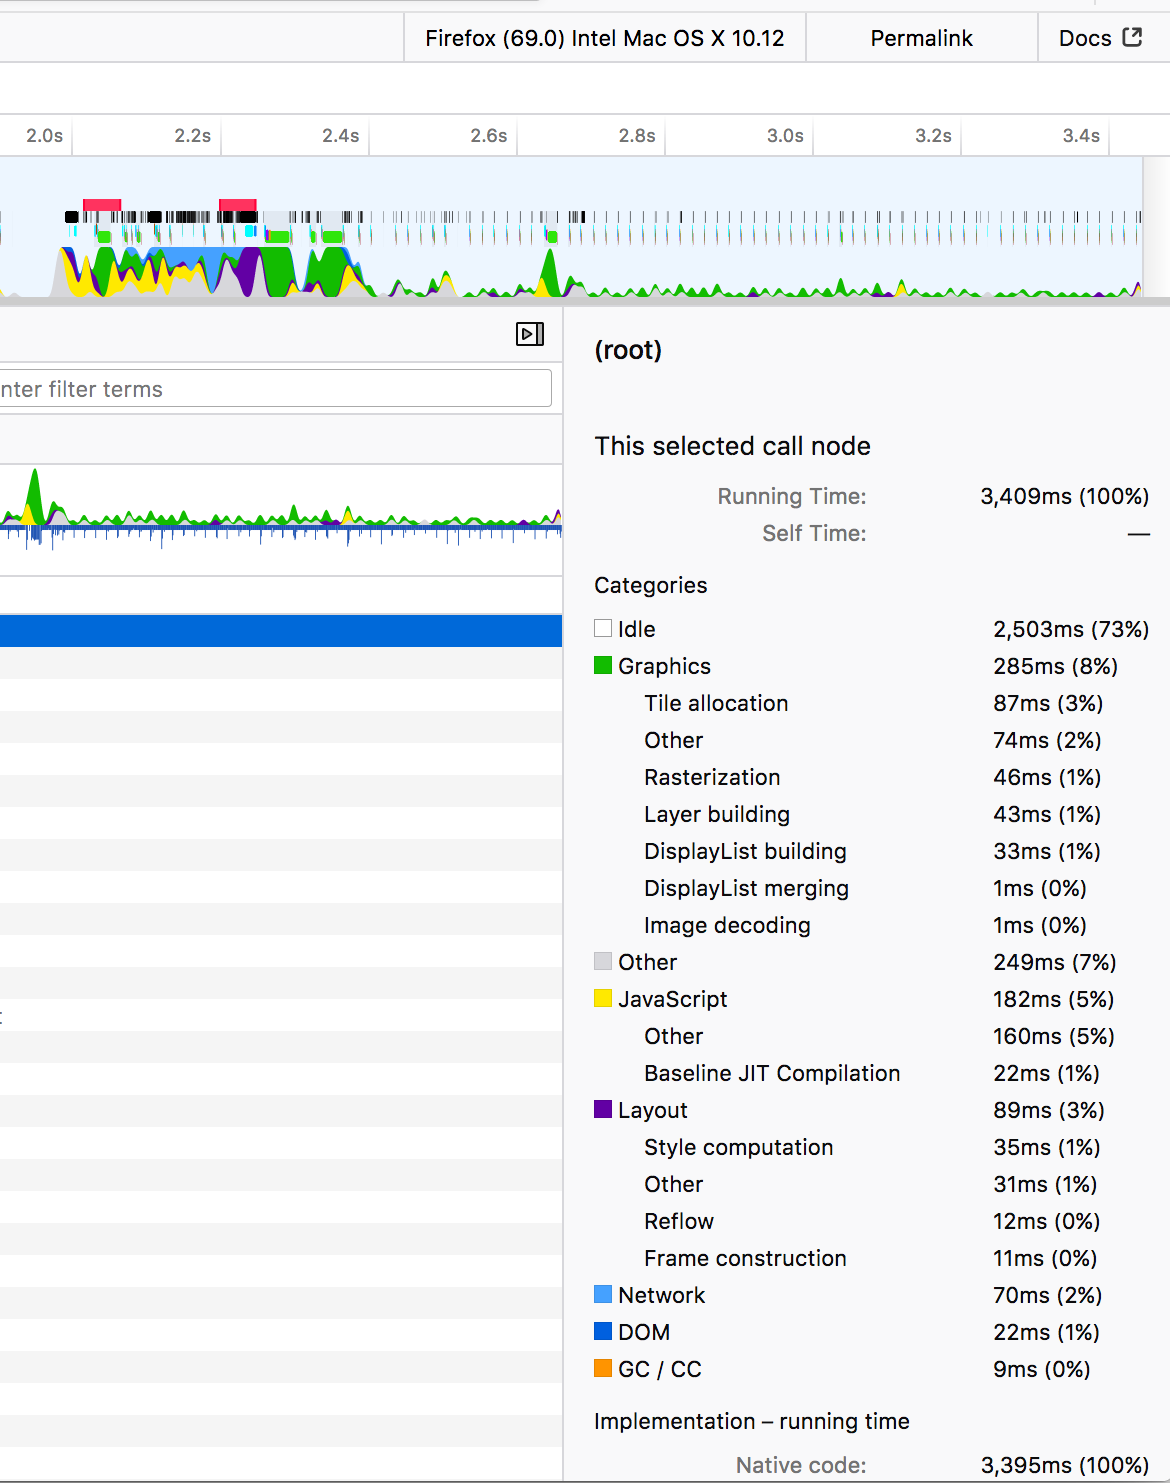
This submenu helps Firefox developers know where your precious time is being spent when examining performance profiles.
-
- Javascript only stacks now include more information about the things that are happening on C++ side.
-
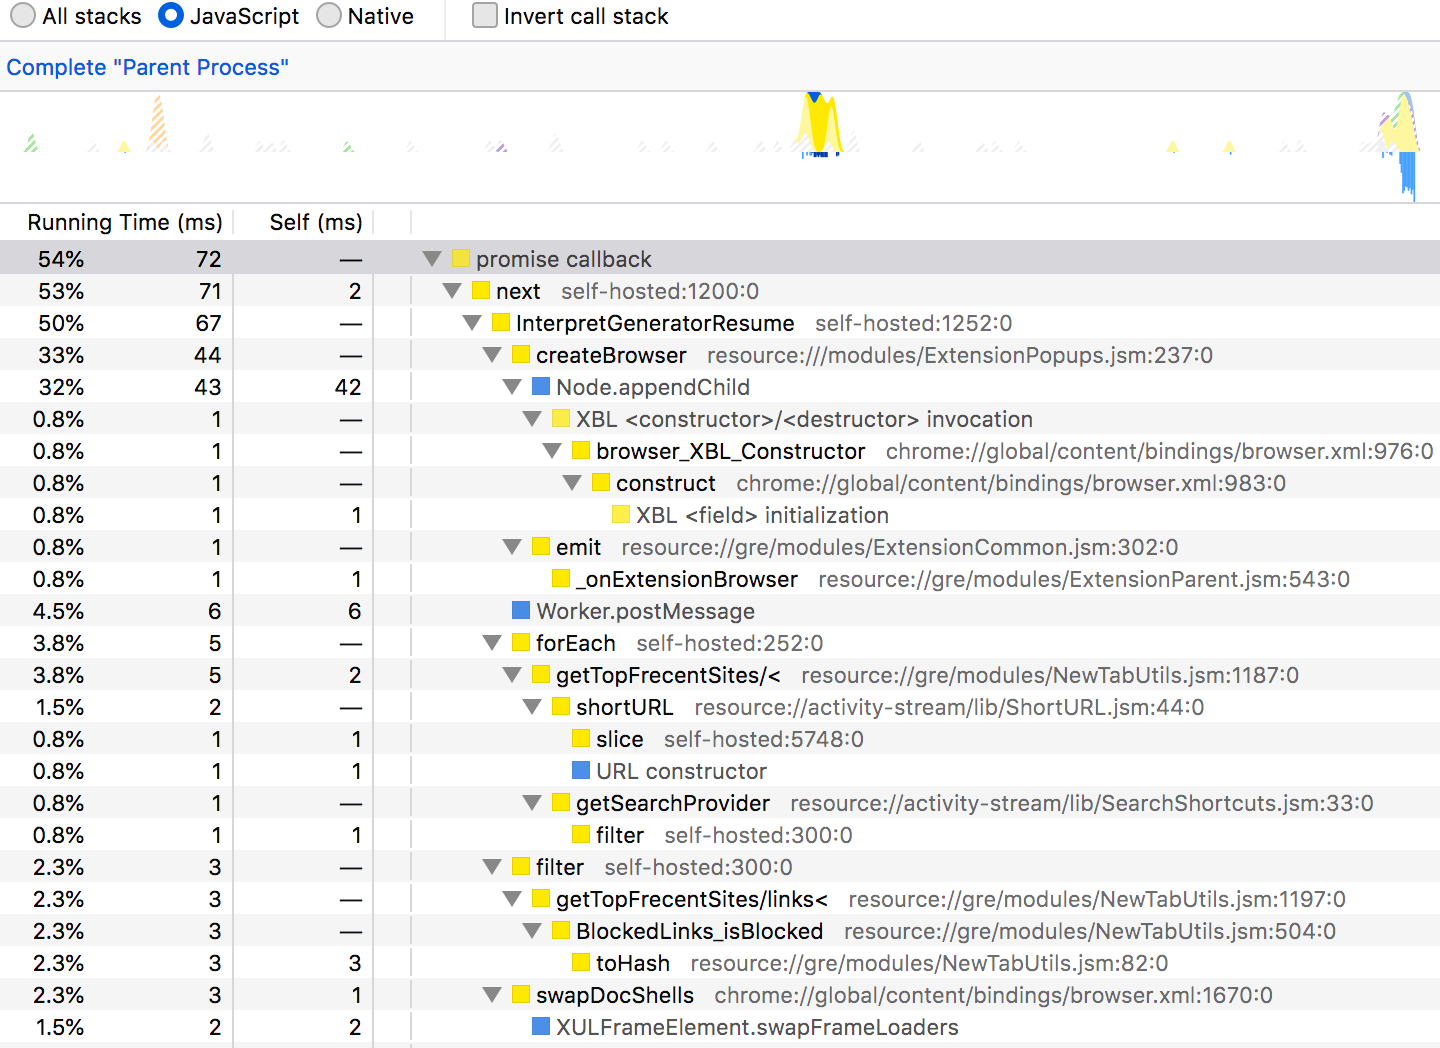
Special frames have been added in the JavaScript-only mode of the Call Tree Viewer which help make it clearer what the JavaScript was doing with the DOM.
-
- More markers have backtraces in the tooltip now.
-
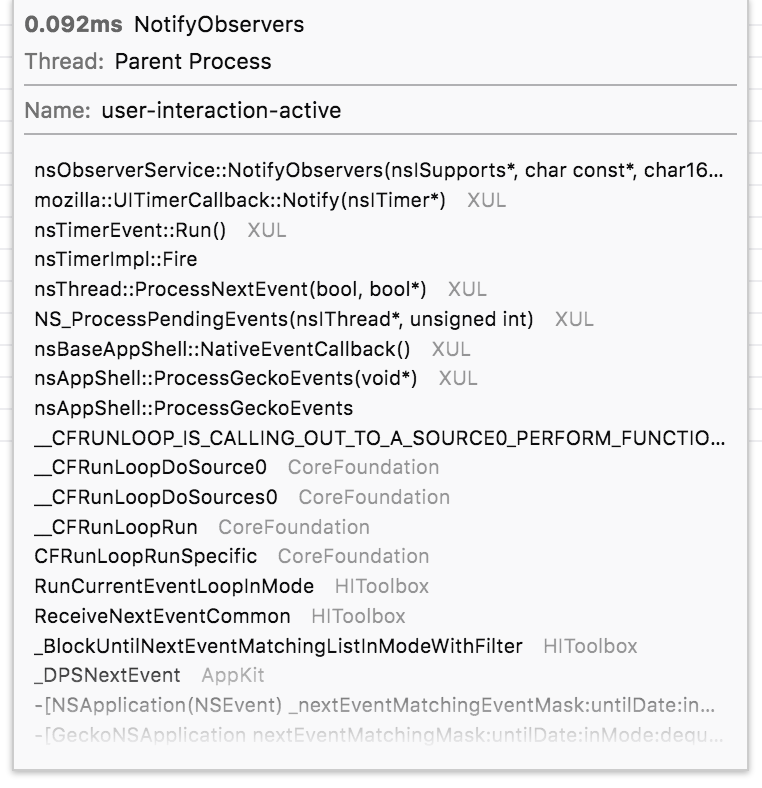
Firefox Developers get more hints this way about why certain things happened that might be taking up time.
-
Picture-in-Picture
- We’re all set to ride out (and hold) to Firefox 69 Beta and Developer Edition to get user feedback. Expect a Hacks blog post near the release!
- Fixed a bug where the toggle would periodically display for a split second while the video metadata was still being gathered, even if PiP was disabled
- Also fixed an issue where the indicator icon in the originating tab for a PiP video would make the tab too wide if pinned
- Fixed an issue where the toggle would appear on audio-only media
- The player window now defaults its initial position to the left bottom of the screen in RTL builds
- Upcoming
Search and Navigation
Search
- Refined the new search engines configuration model, see the new in-tree documentation, implementation ongoing
- Further improved search engines configuration reliability
- Work is ongoing on allowing a different search engine in private browsing mode
Quantum Bar
- On track to be released with Firefox 68, fixed a few regressions in these weeks
- Working on many experiments: at least 2 of them targeted to 69, 3 targeted at 70, more incoming
- Started working on a partial address bar UI refresh for Firefox 70 (internally known as the Mega Bar)
- Started working on legacy address bar code removal
Places
- Old bookmark annotation data and a few related APIs have been removed in Firefox 69 (1 year after the version that removed descriptions with a release note)
User Journey
- Created new “Messaging System” bugzilla component currently covering What’s New panel, Contextual Feature Recommendations, Onboarding / First Run, Snippets
- Adding Feature Callouts to toolbar and menu items as well as What’s New to highlight Firefox features and updates
- Turned on Trailhead “Join Firefox” about:welcome messaging with “Privacy” cards for all locales in 68+
No comments yet
Post a comment