Highlights
- You can now import logins and passwords from Chrome on macOS.
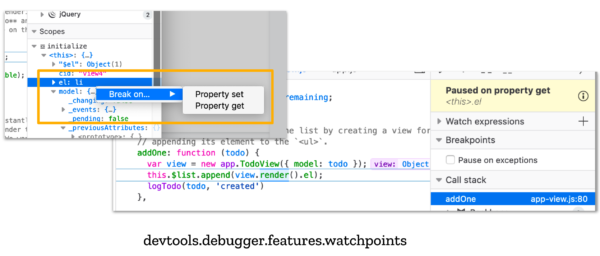
- Watchpoints are now available in the Dev Tools debugger! Give them a try by flipping the
devtools.debugger.features.watchpointspref.
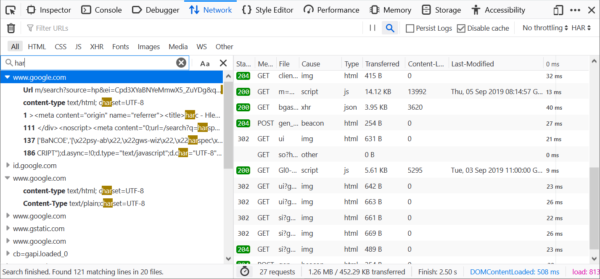
- You can now search across all HTTP requests—POST request bodies, response bodies, headers, and cookies—in the Network Monitor! Press Ctrl+Shift+F, or Cmd+Shift+F on macOS, to try it out.
- We are seeking for feedback at this point, so please file a bug if you have any issues!
- Firefox 69 shipped Enhanced Tracking Protection turned on by default. Our goal for ETP (in “standard” mode) is that it should not break websites. If you’re running on “standard” protections and notice website breakage from ETP, please file a bug on Bugzilla.
- Work continues on the “Megabar” redesign.
- Added an animation and fixed URL selection on focus.
- You can test this out right now by setting
browser.urlbar.megabarto true, and restarting Firefox.
- Firefox Private Network V11 is ready for testing! Get it on https://private-network.firefox.com/ (US only)
- Thank you for testing and filing tons of issues. Please make sure you’re on the latest version.
Friends of the Firefox team
Resolved bugs (excluding employees)
Fixed more than one bug
- :prathiksha
- Itiel
- Maxime Vaillancourt
- Miriam
- Nils Maier [:nmaier]
- Sorin Davidoi
- Yuan Cheng
New contributors (🌟 = first patch)
- 🌟 abowler2 cleaned up some unused variables in some of our WebExtensions tests and also got rid of some redundant CSS in our certificate viewer code
- Alex R. fixed a bug where our JavaScript Debugger would sometimes show an older script when pretty-printing
- Brian Chen made it so that more of about:preferences uses Fluent for localization
- Yuan Cheng fixed a bug where sometimes we’d show a modal warning the user about discarding edits to a login that they were already deleting in about:logins, and also fixed an issue in about:logins where the favicon for a site wouldn’t display correctly
- 🌟 Maxime Vaillancourt added a separator after the Computed Style filter input in the DevTools Inspector, and also fixed a keyboard navigation bug in the Inspector when using an RTL locale
Project Updates
Add-ons / Web Extensions
- As part of bug 1578508, Shane worked on fixing bugs related to cleaning up the preferences controlled by the extensions when the extension is uninstalled (Bug 1576266, Bug 1580049, Bug 1438364 and Bug 1411046)
- Rob ensured that the expected scroll offset is restored when navigating between the HTML
about:addonsviews - As part of Bug 1570715, Rob has also added a new
extensions.webextensions.warnings-as-errorspreference (which defaults to true in tests). This preference is used to ensure that errors are raised when a deprecated WebExtensions manifest property or API in used in a test where it wasn’t expected (see also: theExtensionTestUtils.failOnSchemaWarningstest helper allows the developer to avoid the error when/where appropriate). - Luca removed the
extensions.cookiesBehavior.overrideOnTopLevelpreference and the unused code locked behind it. It was deprecated, and also problematic for Fission-related changes to the anti-tracking internals—and the deprecated behavior was planned to be removed in Firefox 71, after 3 releases. - Nils Maier (DownThemAll! author) contributed a new
allowHttpStatusoption tobrowser.downloads.download(). This new option allows an extension to ask Firefox to not cancel downloads on HTTP errors. This was the behavior of the downloads API on Firefox before the Chrome compatibility fixes applied by Bug 1576333 and Bug 1579850. - April Bowler cleaned up some unused parts of the
MockProvider(which is used in the AOM tests). Thanks for your contribution, April!
Applications
Firefox Accounts
- You’ll soon be able to sign in to FxA without automatically signing in to Sync. This is an important step in our subscription services story. ✨ Please file bugs if you see issues with signing in, Send Tab, or Sync!
Sync and Storage
- “Choose What to Sync” is coming soon to Fenix! ♻️
- New bookmark sync has been enabled by default in Nightly and Beta for the last few cycles, and will be gradually rolled out to all users in Release 70. 📚
Developer Tools
Console
- The
inspect(x)helper showsxin the appropriate panel (bug 1575240) - Editor Mode is now in DevEdition (bug 1580871)
Debugger
- Added UI to disable
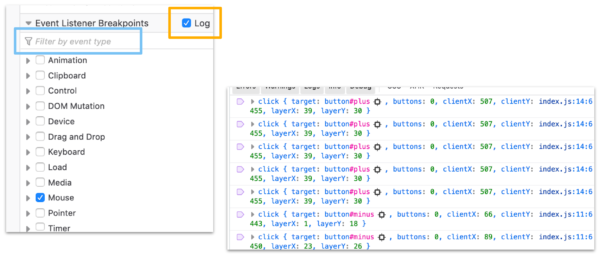
debuggerstatements (bug 1577376) - Added ability to log event listener calls and search event listener breakpoints (bug 1567966)
- Performance improvements for startup and inline preview
Inspector
- Fixed a bug where the Inspector stopped working when the “disable HTTP cache” option was used (bug 1572933)
- Made auto-complete in the rules view more resilient (bug 1543782)
- The rules view now shows
:visitedstyles (bug 713106) - Color swatches now appear next to custom properties that appear to be valid colors! (bug 1456167)
Fission
- Findbar is done. Only one regression so far, to be fixed soon.
- Next up: fixing autocomplete for the password manager! 🔐
- mconley, Gijs and barret are mentoring MSU students to fix some smaller components
PopupBlocking- Picture-in-Picture
- Page Style
PageThumbsPurgeSessionHistory
Lint
- Shashank enabled ESLint for
dom/xhr.- We’ve now got ESLint enabled everywhere except
dom/media/test/, and a few remaining DevTools paths.
- We’ve now got ESLint enabled everywhere except
- Monika enabled
prefer-boolean-length-checkforbrowser/andtoolkit/ no-async-promise-executorhas been fully rolled out tobrowser/,toolkit/anddevtools/.
Mobile
- Fennec (Firefox for Android) will be removed from mozilla-central during the current 71 cycle. The tracking ticket is Bug 1582218.
Performance
- emalysz made it cheaper to gather some process and operating system information for
TelemetryEnvironment.jsmon startup, and got rid of some unnecessary main-thread IO we were doing every startup - Gijs is slogging away trying to avoid synchronous scanning for Flash on startup, and recently removed a bunch of plugins main-thread IO that’s no longer necessary
- dthayer is consulting with the team that worked on Price Wise to figure out how Fathom can be used performantly to examine pages for things like buyable items, and also trying to speed up the
StartupCache - mconley is consulting with the Fluent team to evaluate the performance impacts of the current implementation and make recommendations
Performance Tools
- Recording of native allocation stacks have landed in Nightly. It’s experimental, but you can enable it in the profiler features and give it a try. The front-end side is still a work in progress, but you can see an example profile here.
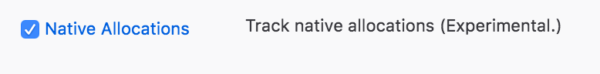
Be sure to check the “native allocations” checkbox in the profiler settings!
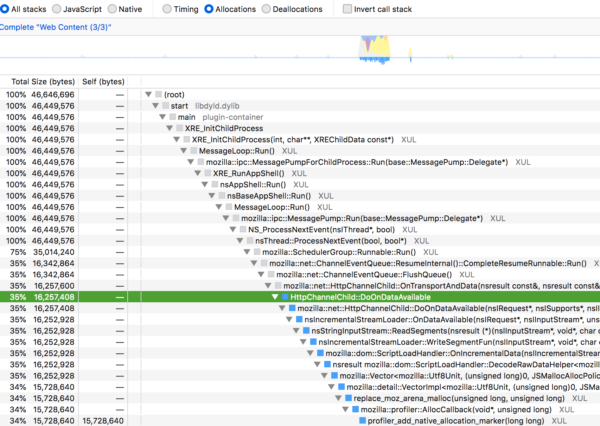
Allocation stacks in the call tree
- The new marker infrastructure has landed, reducing the cost of markers by storing them in the profiler buffer.
- Visualization of JS tracer data has landed. The JS tracer is not enabled right now in Firefox, but you can see your old JS tracer data. Here’s an example profile.
- Michael, one of our most impactful contributors, is working on the profiler popup dark mode.
Picture-in-Picture
- We’re still on track to do a slow rollout of the feature in Firefox 71 for Windows users. Coordinating with pascalc on the relman side.
- Notice a PiP bug on Windows? Please file it blocking this meta bug.
- Fixed:
- A bug where the toggle would sometimes appear even if Picture-in-Picture was disabled by default
- A bug where the toggle would not appear for videos that have pointer-events: none set on them
- A bug where snapping the video with Windows Aero snap with the mouse would add white bars above and below the player window
- The player window not having a title in the Windows taskbar menu
- The Picture-in-Picture indicator not being very visible sometimes with a dark theme enabled
- Upcoming:
- Bug 1549442 – Picture-in-Picture toggle does not collapse or disappear if the mouse moves outside of the window.
- Bug 1581942 – Snapping Picture-In-Picture videos to the left/right/top with the keyboard displays thick white bars on the video’s sides
- Bug 1582171 – [Amazon Prime] PiP window becomes white if the next episode is loaded
- Bug 1582178 – [Amazon Prime] PiP window becomes white after closing the video in the main window of the browser
- Bug 1582106 – PiP window conflicts with YouTube mini player functionality
- Bug 1562218 – [Intermittent] PiP window displays only a white border instead of a video, presuming we can find a way of reproducing this reliably
Privacy/Security
![]()
- Paul is working on removing
nsIPermissionManagerinterfaces that accept a URI and he’s almost done! Follow along here.- There’s also a slightly bigger effort going on to avoid using URIs to make security decisions, and use principals instead.
- We’re looking into what it takes to remove
nsContentBlockerfor performance and maintenance reasons.- Previous attempt didn’t take into account image blocking, so we’re adding telemetry for that.
- Prathiksha is now almost done with transitioning
about:certerrorto useRemotePageManager. - Thomas is working on shipping Feature Policy and adding Permission Delegation on top of it.
Search and Navigation
Search
- Regression fixes:
- Fixed a case where upgrading to Firefox 69 could break search engine configuration
- Work continues on search engines for private browsing
- Work continues on search configuration modernization
- Tests are now running on both the legacy and the new configuration
Quantum Bar
- Regression fixes:
- Fixed URL bar support for
browser.fixup.dns_first_for_single_wordsand single word host user notification - Fixed overflow and disabling bugs for one-off search buttons.
- Fixed “Paste and Go” to always use the clipboard value
- Fixed URL bar support for
- Work continues on the Search Interventions experiment
- Added a new “tip” result type, that can consume more space than common results, and has different selection behavior.
User Journey
- Added support for remote Fluent files via Remote Settings, offering off-train localization for all the remote messages.
- Working on more CFR messages that promote various Firefox features, like:
No comments yet
Post a comment