One of the areas we have been focusing on lately is getting crashes on file for Nightly. The Platform team created Project Uptime to specifically focus on improving our crash situation on Desktop and Mobile. I immediately was interested in being a part of Project Uptime since I have always enjoyed investigating crashes.
The Uptime effort helps the overall Nightly product development for several reasons:
- Identifies issues early to make the product better
- Allows us to quickly identify regression ranges
- Helps catch crashes in Nightly before they might move to Aurora
- Keeps Nightly stable so we can retain users
My Typical Workflow
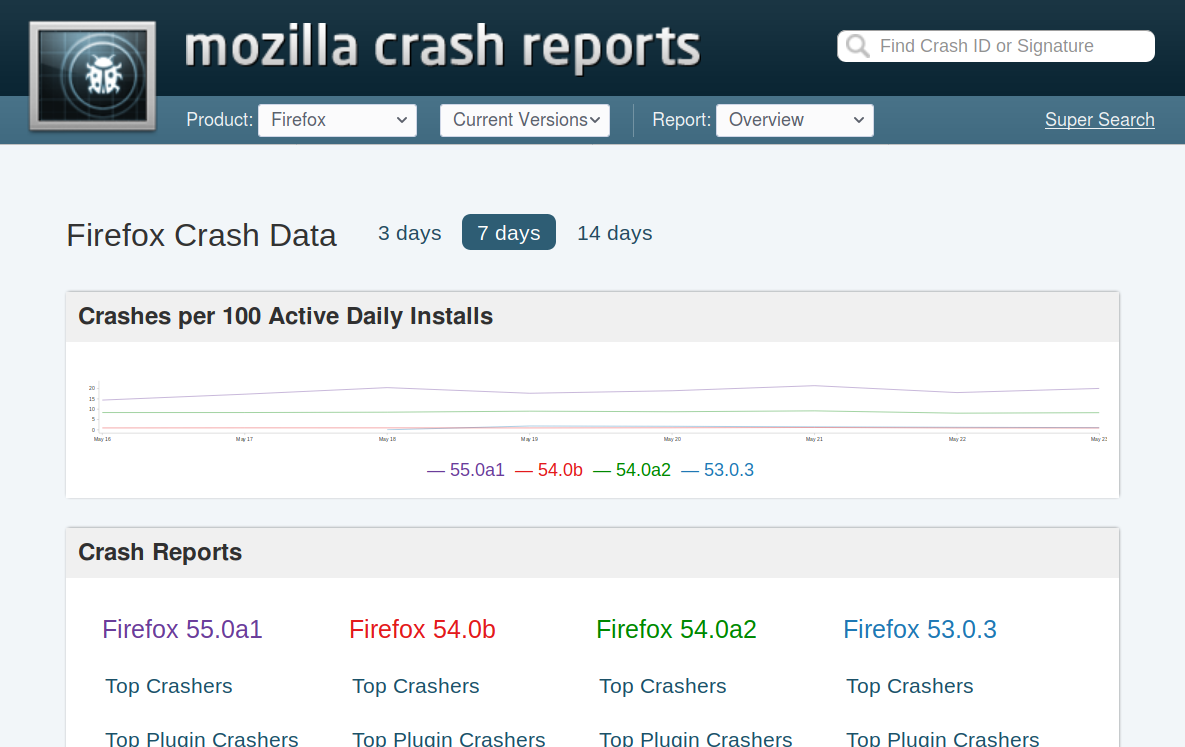
Once a week I look at the crashes in Crash Stats. We have a set of queries we reference that help make it easier to drill down by Platform as well as by type of crash.
Where it starts
If I see a new signature that doesn’t have a bug associated with it, I begin looking at the crashes in that signature. On Uptime we are usually looking at a crash volume on Nightly of 10 times a day or more, across multiple installations. On platforms such as Mac and Linux where we have less crash volume, I might file a bug that has less volume than that of a Windows crash.
An Example
Bug 1284051 is a good example of a bug I caught recently that was a small volume regression. The link to all the crashes showed me in what build the crash started. In this case the crash started with Build ID 20160630030207 and then continued in the Nightly builds for several days.
I start the process by looking at the set of crash reports and determining if they are from a set of users or from an individual user. In the screenshot below you can see that the install times are all different for this particular crash:

Note that there are sometimes crash spikes with a particular signature, but they all come from a single installation and turn out to be duplicates. In the typical Uptime workflow we ignore these, because it’s difficult to tell if it’s a actually a real problem or a specific problem with the user’s machine or installation.
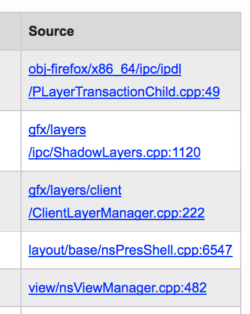
I then look at an individual crash report and determine what stack we may have crashed in. The “Source”column in the attached screenshot may give me some clues about who last worked in that area of code.

In this particular example I was able to find “nsilva” had worked in that area by clicking on the second link, so I added a “needinfo” on him in the Bugzilla bug to see if he could help me figure out what might be causing the crash. One thing to remember is that although the Source column can be useful, you really need to expand the “Show Other Threads” to see the full picture (and you may need the help of a developer to untangle what is going on – I often do). You can also reference the Module Owners list if you are not sure who oversees a particular area of code. Lots of times you may not know where to bucket the crash – and when this happens don’t be afraid to ask for help (IRC is your best friend).
All of the information I find that is relevant goes into the bug report. Other items I may add include:
- Module or addon correlations
- Crash URLs, if there is trend
- Added comments, if there is a trend
- Uptime range if it is a startup crash
Other helpful items to include in the bug report (from the Uptime page):
- From about:support: The Nightly build id, which looks like “20160506052823”
- Number of crashes that have occurred with this signature. I usually paste a link which includes all the crashes across branches, or on a particular branch if it is branch specific.
- Crash rank (e.g. “this is the #1 top crash for Nightly 20160506052823”)
- Number of installations
- For new signatures, which Nightly build the crash started in. This page explains an easy way to search for this in Crash Stats.
- When possible, a regression window for that Nightly. Adding “regression” and “regressionwindow-wanted” to the keyword field will also help trigger someone to help.
- When possible, an indication of which bug’s patches may have caused the crash.
- To get the attention of Release Drivers, nominate the bug by setting the appropriate tracking flag to ‘?‘ in the bug report.
This bug had a happy ending as nsilva was able to address the crash with a null check.
Platform specific crashes are another interesting area I like to explore. Since I run the Mac developer builds, I look at crashes specific to the next Mac OS version daily. It is possible in Crash Stats to construct a query which will return only the crashes that are present on the most recent Sierra beta. This is useful to be able to see and address early issues while the OS is under development. (You can also help the effort by joining the Apple beta program and running Sierra with Firefox installed – more users helps us identify issues more quickly 🙂 )
In summary, crash investigation is a fascinating part of browser development. It has many unique challenges, and often investigating a crash can be a bit like solving a puzzle.
For example, crashes with different causes can get lumped under the same signature, making it difficult to separate out all the different issues. We have challenges with third party DLLs, plugins and addons, and malware – sometimes just finding the right contact within an organization can be tricky. There may be slightly different crash signatures for Windows, Mac, and Linux and we have to account for that when reviewing the data. At the end of the day though, for me there is great satisfaction in filing a crash and watching it progress toward a fix.

Marc wrote on
alex_mayorga wrote on
Vickie Peters wrote on
agus wrote on
PHAM THANH TUYEN wrote on
Cal wrote on
FireMouse wrote on
Wellington Torrejais da Silva wrote on